. 2012 Dec;13(14):1512-21.
doi: 10.4161/cbt.22280. Epub 2012 Sep 18.

CLCA2, a target of the p53 family, negatively regulates cancer cell migration and invasion

Affiliations

CLCA2, a target of the p53 family, negatively regulates cancer cell migration and invasion

Yasushi Sasaki et al. Cancer Biol Ther. 2012 Dec.

Abstract

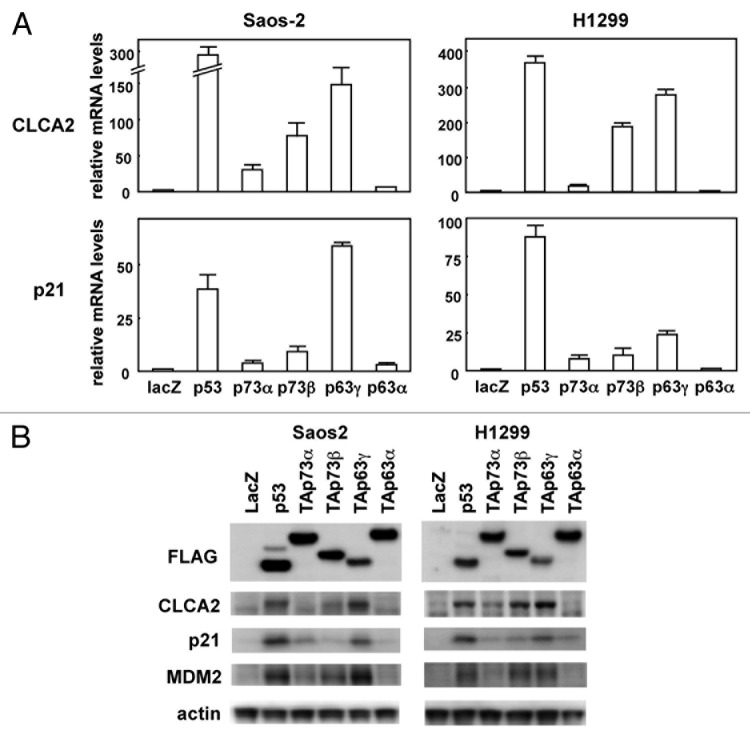
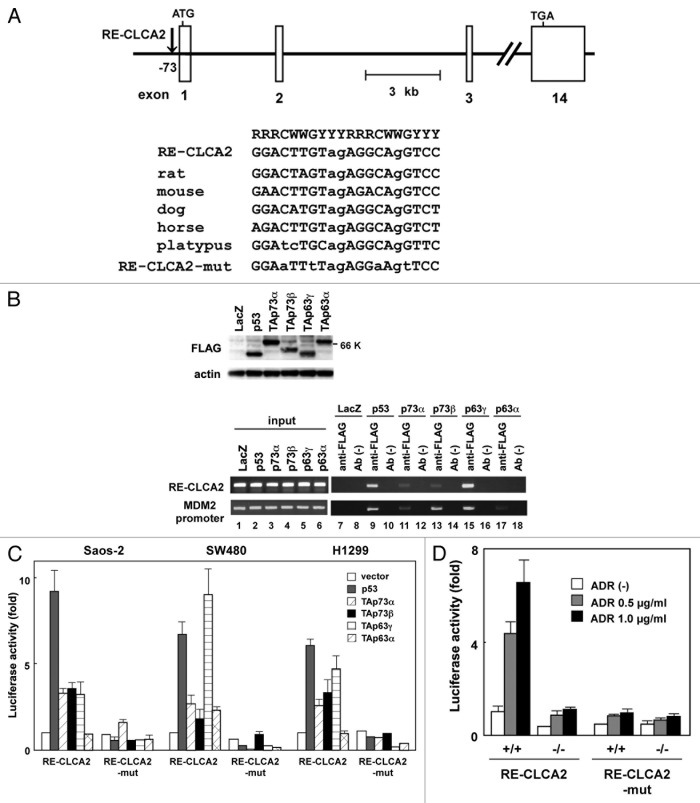
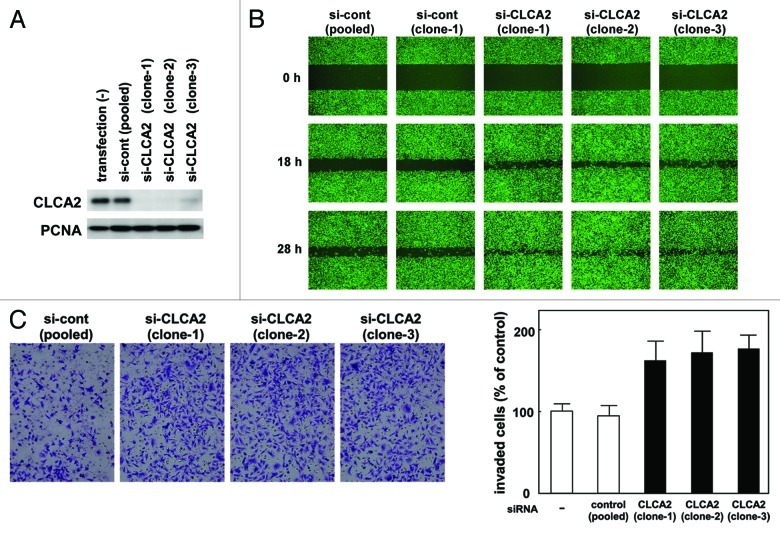
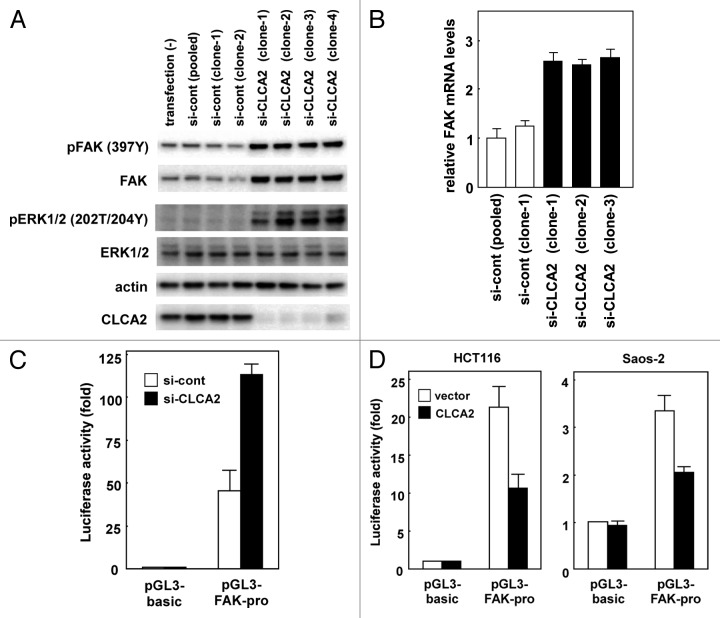
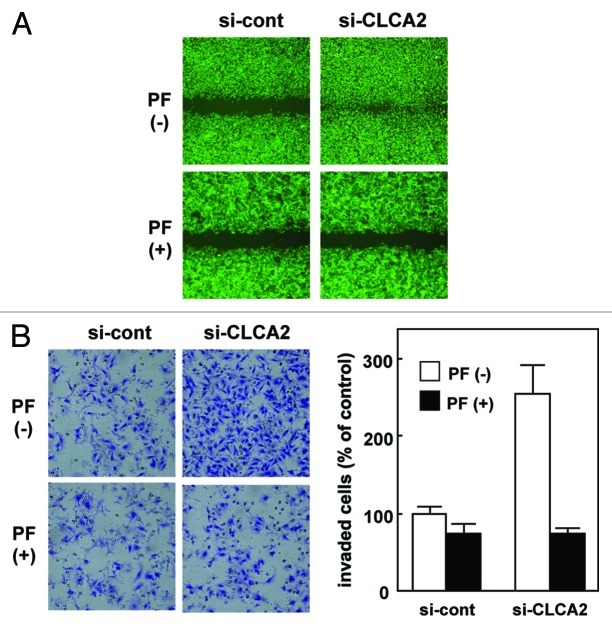
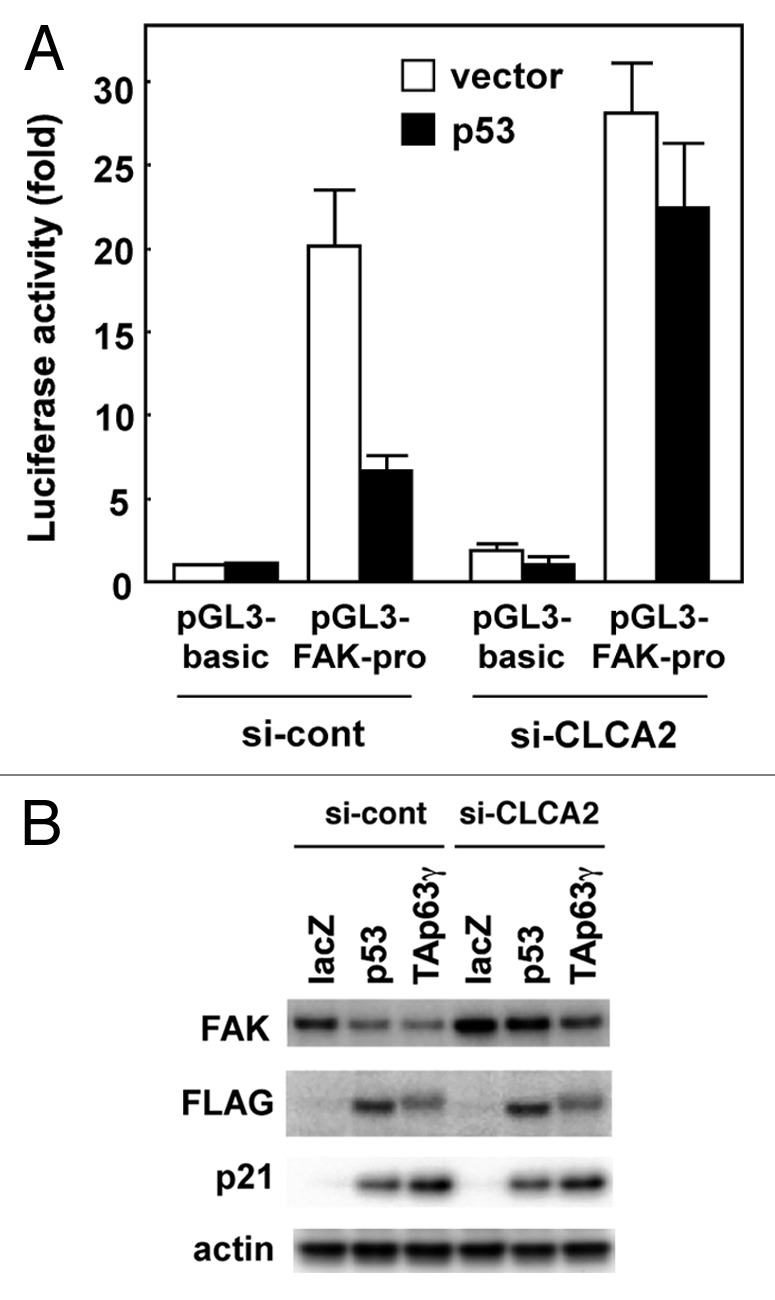
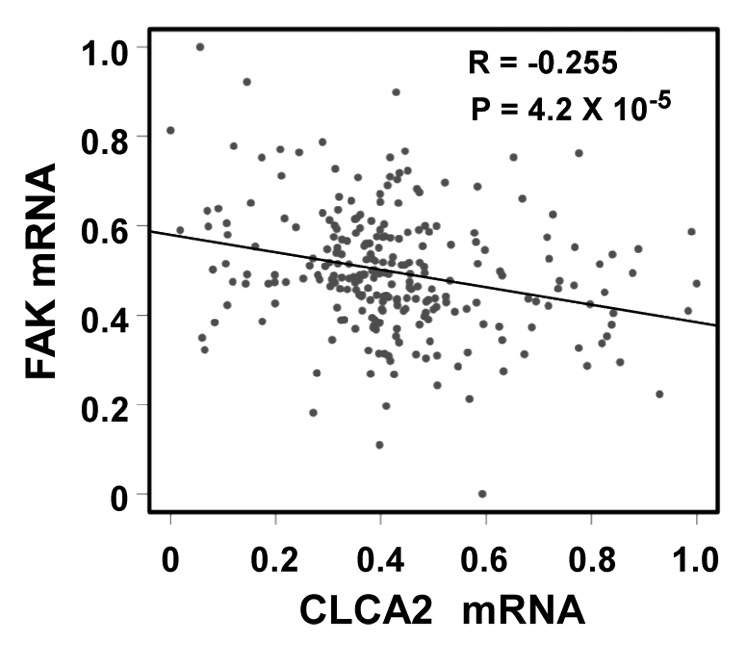
The tumor suppressor p53 transcriptionally regulates a number of genes that are involved in cell-cycle inhibition, apoptosis and the maintenance of genetic stability. Recent studies suggest that p53 also contributes to the regulation of cell migration and invasion. Here, we show that human chloride channel accessory-2 (CLCA2) is a target gene of the p53 family (p53, p73 and p63). CLCA2 is induced by DNA damage in a p53-dependent manner. The p53 family proteins activate the CLCA2 promoter by binding directly to the conserved consensus p53-binding site present in the CLCA2 promoter. In terms of function, ectopic expression of CLCA2 inhibited cancer cell migration. In contrast, silencing CLCA2 with siRNA stimulated cancer cell migration and invasion. We also found that inactivation of CLCA2 enhanced the expression of focal adhesion kinase (FAK), as well as its promoter activation. A small-molecule FAK inhibitor reduced the effect of CLCA2 siRNA on cell migration and invasion, suggesting that CLCA2 inhibits cancer cell migration and invasion through suppression of the FAK signaling pathway. Furthermore, there was an inverse correlation between CLCA2 and FAK expression in 251 human breast cancer tissues. These results strongly suggest that CLCA2 is involved in the p53 tumor suppressor network and has a significant effect on cell migration and invasion.


Figures

None
Figure 1. Upregulation of the CLCA2 mRNA and protein by the p53 family. (A) Upregulation of CLCA2 mRNA by p53 family members in human cancer cell lines. Saos-2 and H1299 cells were infected with replication-deficient recombinant adenoviruses encoding human p53 family proteins with an N-terminal FLAG epitope or the bacterial lacZ at an MOI of 25 for 24 h. CLCA2 and p21 mRNA levels were assayed using real-time PCR. Values shown are the mean ± standard error of three independent experiments normalized to their respective controls as 1. (B) Upregulation of CLCA2 protein by p53 family members in human cancer cell lines. Cells were infected with adenoviruses as described above, and an immunoblot analysis of FLAG, CLCA2, p21, MDM2 and β-actin was performed.
None
Figure 2. Regulation of CLCA2 transcription by the p53 family. (A) The position and nucleotide sequence of a response element for the p53 family in the CLCA2 gene RE-CLCA2. Open boxes represent exons. RE-CLCA2 is located 73-bp upstream of the first exon and consists of two copies of the consensus 10-bp motif of the p53-binding sequence. The consensus sequences are indicated by uppercase letters. Lowercase letters identify mismatches with the consensus sequence. The alignment of the conserved binding sites in rat, mouse, dog, horse and platypus sequences from the CLCA2 gene is shown at the top. A mutated sequence corresponding to potentially critical nucleotides of RE-CLCA2 used in the luciferase assay is also indicated (RE-CLCA2-mut). R represents purine; Y, pyrimidine; W, adenine or thymine. (B) p53 family proteins bind to the RE-CLCA2 site in vivo. Expression of FLAG-tagged p53, p73 and p63 is shown in adenovirus-infected Saos-2 cells. Cells were infected with adenovirus at an MOI of 25 and were harvested 24 h after infection. Immunoblot analysis was performed on lysates (10 µg) of cells infected with Ad-lacZ, Ad-p53, Ad-p73α, Ad-p73β, Ad-p63γ and Ad-p63α. In vivo recruitment of p53 family proteins to the RE-CLCA2 site (right). Cross-linked chromatin was extracted from Saos-2 cells after infection with Ad-LacZ, Ad-p53, Ad-p73α, Ad-p73β, Ad-p63γ and Ad-p63α and immunoprecipitated with an anti-FLAG antibody. The immunoprecipitated material was amplified using primers specific for RE-CLCA2 (1st panel) and the MDM2 promoter (2nd panel). “Input chromatin,” which represents a portion of the sonicated chromatin prior to immunoprecipitation, was used as a positive PCR control (lanes 1 to 6). Immunoprecipitates in the absence of antibody (Ab (-), lanes 8, 10, 12, 14, 16 and 18) served as negative controls. (C) The RE-CLCA2 sequence is responsive to p53 family proteins. Saos-2, SW480 or H1299 cells were transiently transfected with the pGL3-promoter vector containing the RE-CLCA2 (pGL3-RE-CLCA2) or its mutant (pGL3-RE-CLCA2-mut) along with a transfection-control plasmid expressing Renilla luciferase, pRL-TK. Cells were cotransfected with a control pCMV-Tag2 vector or a vector that expresses p53 family members 24 h prior to performing the luciferase assay. Luciferase activity was measured using the dual-luciferase reporter assay system with the Renilla luciferase activity as an internal control. All experiments were performed in triplicate, and the means and standard deviations are indicated by bars and brackets, respectively. (D) The regulation of CLCA2 transcription by endogenous p53. HCT116-p53(+/+) and HCT116-p53(−/−) cells were co-transfected with pGL3-RE-CLCA2 or pGL3-RE-CLCA2-mut together with pRL-TK. At 4 h after transfection, cells were treated with 0, 0.5 or 1.0 µg/ml ADR for 24 h and subjected to a dual luciferase assay. Firefly luciferase activity relative to the Renilla luciferase control is given. Experiments were conducted in triplicate with standard deviations indicated. Activity in the control HCT116-p53(+/+) cells was set to 100%.
None
Figure 3. CLCA2 siRNA promotes cancer cell migration and invasion. (A) western blot analysis after stable transfection of GFP-tagged CLCA2 siRNA plasmid (iLenti-si-CLCA2) or empty plasmid (si-cont) in CHC-Y1 colorectal cells. The results from untransfected CHC-Y1 controls, a pooled control, and three independent transfectants [si-CLCA2 (clone-1, 2 and 3)] are shown. (B) Wound-healing assay of CLCA2 siRNA plasmid-transfected human cancer cells. Phase contrast images were taken 0, 18 and 28 h after wounding. Representative images showing increased cell migration to the wounded area in CLCA2 siRNA-transfected CHC-Y1 cells. (C) Cell invasion was measured in a Matrigel invasion assay following stable transduction. The experiments were repeated three times with similar results. Representative images showing increased cell invasion in CLCA2 siRNA-transfected CHC-Y1 cells. Quantification of invasion as a percentage of the control is also shown (right).
None
Figure 4. Regulation of FAK transcription by CLCA2. (A) western blot analysis after stable transfection of CLCA2 siRNA plasmid or empty control plasmid (si-cont) in CHC-Y1 cells. The results from untransfected CHC-Y1 cells, a pooled control, two control clones [si-cont (clone-1 and -2)] and four independent CLCA2 siRNA transfectants [si-CLCA2 (clone-1, to -4)] are shown. Inhibition of CLCA2 expression by siRNA results in the induction of FAK protein levels and activated ERK. (B) FAK mRNA levels were assayed using real-time PCR. (C) CLCA2 siRNA upregulated FAK promoter activity. HEK293 cells were co-transfected with the FAK promoter-reporter construct P1020 together with CLCA2 siRNA plasmid (si-CLCA2) or empty plasmid (si-cont). After 24 h, cells were lysed in a plate and subjected to the dual luciferase assay. The pGL3-basic vector without the inserts was used as a control. Histograms show firefly luciferase activity relative to Renilla luciferase control. Experiments were conducted in triplicate with SD indicated. (D) The repression of FAK promoter activity by CLCA2. HCT116 and Saos-2 cells were co-transfected with the P1020 FAK-promoter construct together with a CLCA2 expression vector or empty vector plasmid (vector). At 24 h after transfection, cells were lysed in a plate and subjected to the dual luciferase assay.
None
Figure 5. The migration- and invasion-enhancing effects of CLCA2 siRNA were inhibited by the addition of FAK inhibitor. (A) The migration-enhancing effect of CLCA2 siRNA was inhibited by the addition of FAK inhibitor. Control and CLCA2-silenced CHC-Y1 cell monolayers (clone-1) on collagen-coated coverslips were scratched manually with a plastic pipette tip. Cells were washed with fresh medium to remove floating cells and cultured with or without 10 µM PF-573228. Wound healing was monitored at 24 h after scratching. (B) The invasion-enhancing effect of CLCA2 siRNA was inhibited by the addition of FAK inhibitor. Cell invasion was measured using a Matrigel invasion assay. Cells were suspended in medium containing 0 or 10 µM PF-573228 (0.5 mL/chamber) and loaded at a density of 1 × 10⁵ cells/mL to an insert of a transwell chamber as indicated. Cells that had invaded to the underside of the inserts after 24 h of incubation were stained and counted by light microscopy. The experiments were repeated three times with similar results. Quantification of invasion as a percentage of the control is also shown (right).
None
Figure 6. p53 downregulates FAK expression, which is inhibited by CLCA2 knockdown. (A) Knockdown of CLCA2 prevents p53-mediated suppression of FAK promoter activity. Control and CLCA2-silenced CHC-Y1 cells were co-transfected with the P1020 FAK-promoter construct together with a p53 expression vector or empty vector plasmid (vector). After 24 h, the cells were lysed in a plate and subjected to the dual luciferase assay. (B) The p53-mediated downregulation of FAK was partially abrogated by CLCA2 siRNA. Control and CLCA2-silenced CHC-Y1 cells were treated with Ad-lacZ, Ad-p53 or Ad-p63γ. After 24 h, cell lysates were prepared, and FAK protein expression was detected by western blotting.
None
Figure 7. A negative correlation between CLCA2 and FAK expression in human breast cancer tissues. An expression microarray experiment conducted by Miller, et al. and available at the GEO database (data set GSE3494) was queried for levels of CLCA2 and FAK. Normalized mRNA signals (lowest = 0, highest = 1) from 251 breast cancer samples were plotted. The Pearson correlation coefficient is shown.

Similar articles

Cited by

References

    1. el-Deiry WS. Regulation of p53 downstream genes. Semin Cancer Biol. 1998;8:345–57. doi: 10.1006/scbi.1998.0097. - DOI - PubMed
    1. Vogelstein B, Lane D, Levine AJ. Surfing the p53 network. Nature. 2000;408:307–10. doi: 10.1038/35042675. - DOI - PubMed
    1. Kaghad M, Bonnet H, Yang A, Creancier L, Biscan JC, Valent A, et al. Monoallelically expressed gene related to p53 at 1p36, a region frequently deleted in neuroblastoma and other human cancers. Cell. 1997;90:809–19. doi: 10.1016/S0092-8674(00)80540-1. - DOI - PubMed
    1. Osada M, Ohba M, Kawahara C, Ishioka C, Kanamaru R, Katoh I, et al. Cloning and functional analysis of human p51, which structurally and functionally resembles p53. Nat Med. 1998;4:839–43. doi: 10.1038/nm0798-839. - DOI - PubMed
    1. Yang A, Kaghad M, Wang Y, Gillett E, Fleming MD, Dötsch V, et al. p63, a p53 homolog at 3q27-29, encodes multiple products with transactivating, death-inducing, and dominant-negative activities. Mol Cell. 1998;2:305–16. doi: 10.1016/S1097-2765(00)80275-0. - DOI - PubMed

Publication types

MeSH terms