. 2012 Dec;13(14):1501-11.
doi: 10.4161/cbt.22275. Epub 2012 Sep 18.

OSU-03012 interacts with lapatinib to kill brain cancer cells

Affiliations

OSU-03012 interacts with lapatinib to kill brain cancer cells

Laurence Booth et al. Cancer Biol Ther. 2012 Dec.

Abstract

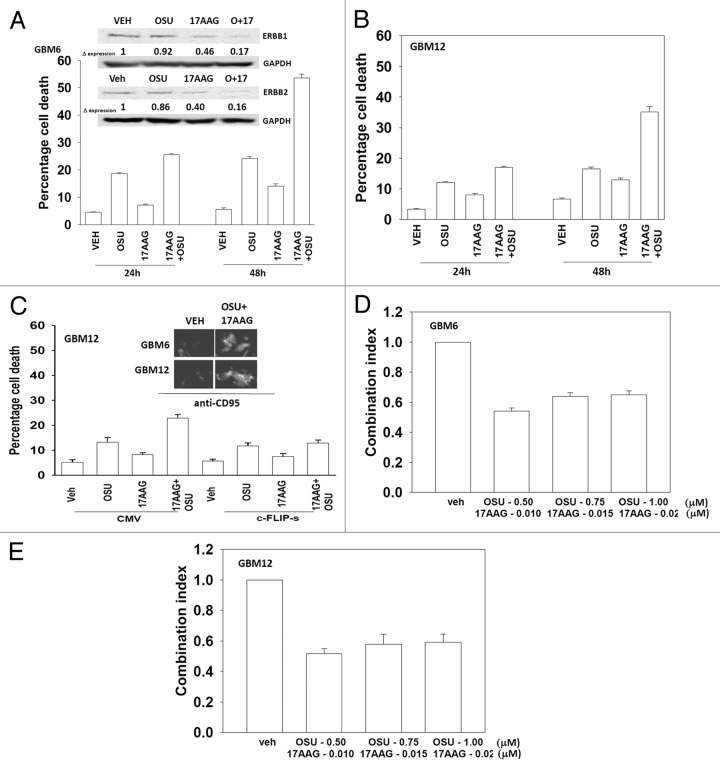
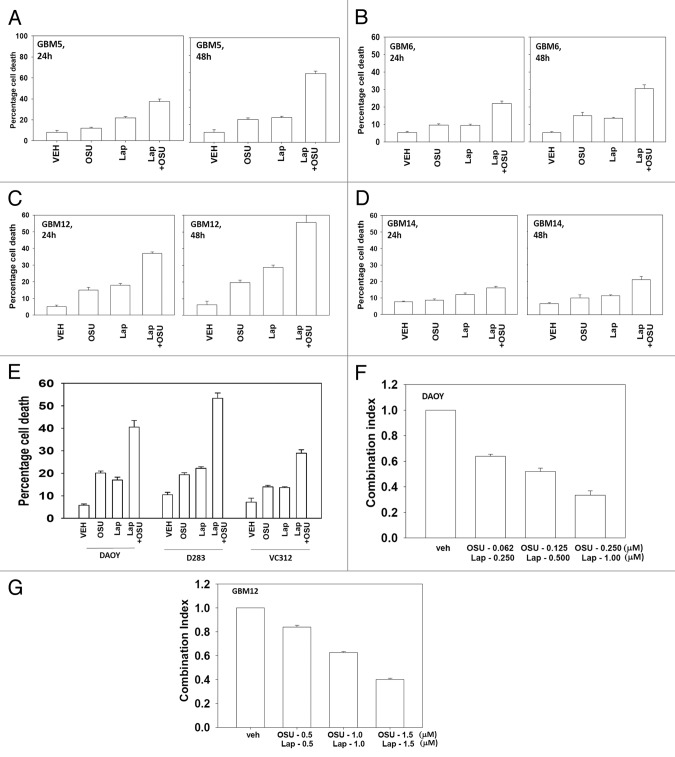
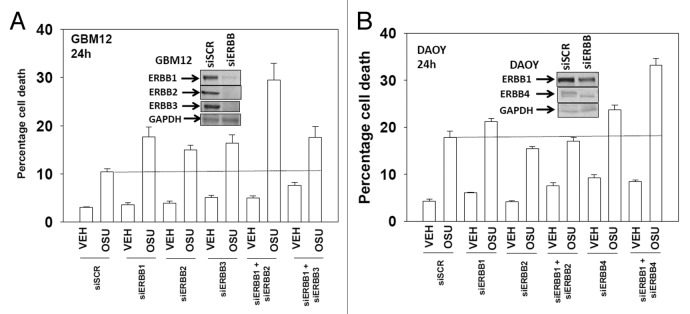
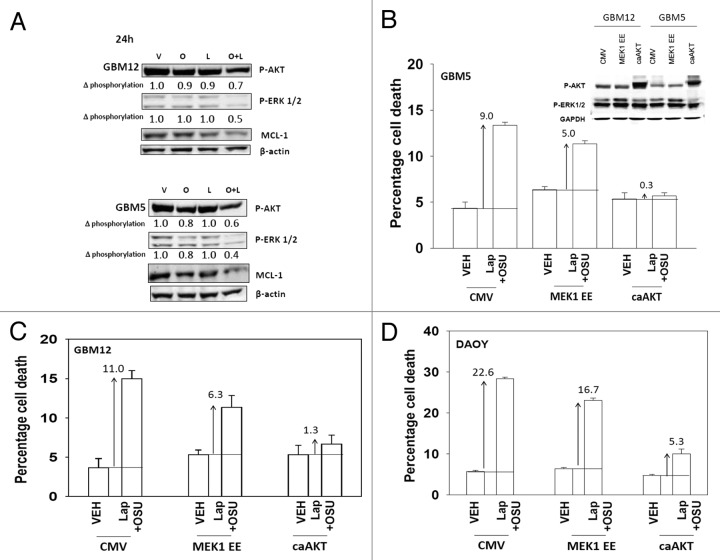
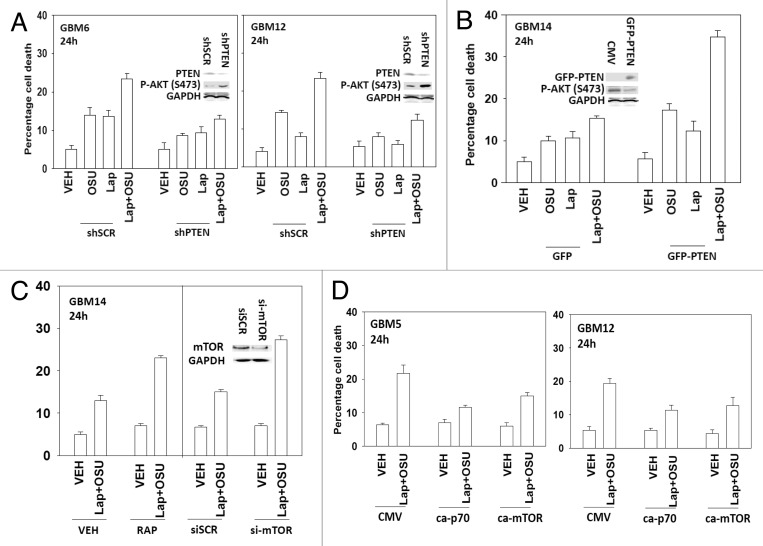
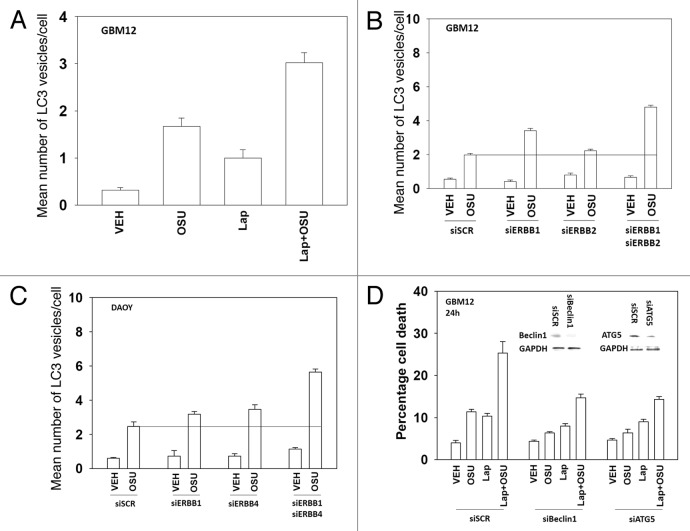
We have further defined mechanism(s) by which the drug OSU-03012 (OSU) kills brain cancer cells. OSU toxicity was enhanced by the HSP90 inhibitor 17-N-Allylamino-17-demethoxygeldanamycin (17AAG) that correlated with reduced expression of ERBB1 and ERBB2. Inhibition of the extrinsic apoptosis pathway blocked the interaction between 17AAG and OSU. OSU toxicity was enhanced by the inhibitor of ERBB1/2/4, lapatinib. Knock down of ERBB1/2/4 in a cell line specific fashion promoted OSU toxicity. Combined exposure of cells to lapatinib and OSU resulted in reduced AKT and ERK1/2 activity; expression of activated forms of AKT and to a lesser extent MEK1 protected cells from the lethal effects of the drug combination. Knock down of PTEN suppressed, and expression of PTEN enhanced, the lethal interaction between OSU and lapatinib. Downstream of PTEN, inhibition of mTOR recapitulated the effects of lapatinib. Knock down of CD95, NOXA, PUMA, BIK or AIF, suppressed lapatinib and OSU toxicity. Knock down of MCL-1 enhanced, and overexpression of MCL-1 suppressed, drug combination lethality. Lapatinib and OSU interacted in vivo to suppress the growth of established tumors. Collectively our data argue that the inhibition of ERBB receptor function represents a useful way to enhance OSU lethality in brain tumor cells.


Figures

None
Figure 1. OSU-03012 toxicity in transformed cells is enhanced by 17AAG. (A) GBM6 cells were treated with vehicle (DMSO); OSU-03012 (OSU) (1 μM) and/or 17AAG (50 nM) as indicated. Cells were isolated 24h and 48h later and viability determined by trypan blue exclusion assay (n = 3 ± SEM). Upper blots: The expression of ERBB1 and ERBB2 was determined 24h after drug exposure. (B) GBM12 cells were treated with vehicle (DMSO); OSU-03012 (OSU) (1 μM) and/or 17AAG (50 nM) as indicated. Cells were isolated 24h and 48h later and viability determined by trypan blue exclusion assay (n = 3 ± SEM). (C) GBM12 cells were infected with empty vector virus (CMV) or a virus to express c-FLIP-s. Twenty four h later cells were treated with vehicle (DMSO); OSU-03012 (OSU) (1 μM) and/or 17AAG (50 nM) as indicated. Cells were isolated 48h later and viability determined by trypan blue exclusion assay (n = 3 ± SEM). Upper IHC: Cells were treated with drugs and 24h later fixed. Immunohistochemistry was performed on fixed un-permeabilized cells to determine the level of plasma membrane localization of CD95. (D and E) GBM6 and GBM12 cells were plated as single cells in sextuplicate. Twelve h after plating cells were treated with 17AAG (0–20 nM) and OSU (0–1.0 μM) at a fixed concentration ratio. After 48h media was removed, the cells washed and drug free media added. Colonies formed over ~14 d. A colony was defined as a group of > 50 cells. A combination index of < 1.00 indicates a synergy of drug interaction (n = 3 ± SEM).
None
Figure 2. OSU-03012 toxicity in transformed cells is enhanced by Lapatinib. (A) GBM5; (B) GBM6; (C) GBM12; (D) GBM14 cells were treated with vehicle (DMSO); OSU-03012 (OSU) (1 μM) and/or Lapatinib (1.0 μM) as indicated. Cells were isolated 24h and 48h later and viability determined by trypan blue exclusion assay (n = 3 ± SEM). (E) DAOY, D283 and VC312 cells were treated with vehicle (DMSO); OSU-03012 (OSU) (1 μM) and/or Lapatinib (1.0 μM) as indicated. Cells were isolated 48h later and viability determined by trypan blue exclusion assay (n = 3 ± SEM). (F and G) GBM6 and GBM12 cells were plated as single cells in sextuplicate. Twelve h after plating cells were treated with OSU (0–250 nM) and Lapatinib (0–1.0 μM) at a fixed concentration ratio. After 48h media was removed, the cells washed and drug free media added. Colonies formed over ~14 d. A colony was defined as a group of > 50 cells. A combination index of < 1.00 indicates a synergy of drug interaction (n = 3 ±SEM).
None
Figure 3. Molecular inhibition of ERBB receptors recapitulates the effects of lapatinib. (A) GBM12 cells were transfected with scrambled control siRNA (siSCR, 20 nM) or with siRNA molecules to knock down expression of ERBB1-3. Twenty four h after transfection cells were treated with vehicle (DMSO) or with OSU-03012 (1 μM). Cells were isolated 48h later and viability determined by trypan blue exclusion assay (n = 3 ± SEM). (B) DAOY cells were transfected with scrambled control siRNA (siSCR, 20 nM) or with siRNA molecules to knock down expression of ERBB1–4. Twenty four h after transfection cells were treated with vehicle (DMSO) or with OSU-03012 (1 μM). Cells were isolated 48h later and viability determined by trypan blue exclusion assay (n = 3 ± SEM).
None
Figure 4. OSU-03012 and lapatinib treatment lowers ERK1/2 and AKT activity that correlates with lower MCL-1 expression. (A) GBM12 and GBM5 cells were treated with vehicle (DMSO); OSU-03012 (O, 1 μM); lapatinib (L, 1 μM) or the drugs combined. Cells were isolated 24h later and the phosphorylation of ERK1/2 and AKT (S473) determined, and the expression of MCL-1 determined. (B–D) GBM5, GBM12 and DAOY cells were infected with empty vector control (CMV) or with viruses to express active MEK1 (MEK1EE) or active AKT (caAKT). Twenty four h after infection cells were treated with vehicle (DMSO) or with lapatinib and OSU-03012. Cells were isolated after 48h and viability determined by trypan blue exclusion (n = 3, ± SEM). Arrows indicate the true percentage difference between vehicle and lap+OSU treatment.
None
Figure 5. OSU-03012 lethality is regulated by PTEN expression. (A) GBM6 and GBM12 cells were transfected with a scrambled control plasmid (shSCR) or a plasmid to knock down PTEN expression (shPTEN). Twenty four h after transfection cells were treated with vehicle (DMSO); OSU-03012 (OSU) (1 μM) and/or Lapatinib (1.0 μM) as indicated. Cells were isolated 24h later and viability determined by trypan blue exclusion assay (n = 3 ± SEM). (B) GBM14 cells were transfected to express GFP or GFP-PTEN Twenty four h after transfection cells were treated with vehicle (DMSO); OSU-03012 (OSU) (1 μM) and/or Lapatinib (1.0 μM) as indicated. Cells were isolated 24h later and viability determined by trypan blue exclusion assay (n = 3 +/− SEM). (C) GBM14 cells were transfected with scrambled control siRNA (siSCR, 20 nM) or with an siRNA molecule to knock down expression of mTOR. Twenty four h after transfection cells were treated with vehicle (DMSO) or with lapatinib (1 μM) and OSU-03012 (1 μM). Cells were isolated 24h later and viability determined by trypan blue exclusion assay (n = 3 ± SEM). In parallel untransfected cells were treated with vehicle (DMSO) or with rapamycin (10 nM); then cells were treated with vehicle (DMSO) or with lapatinib (1 μM) and OSU-03012 (1 μM). Cells were isolated 24h later and viability determined by trypan blue exclusion assay (n = 3 ± SEM). (D) GBM5 and GBM12 cells were transfected with empty vector plasmid (CMV) or plasmids to express activated forms of p70 S6K or of mTOR. Twenty four h after transfection cells were treated with vehicle (DMSO) or with lapatinib (1 μM) and OSU-03012 (1 μM). Cells were isolated 24h later and viability determined by trypan blue exclusion assay (n = 3 ± SEM).
None
Figure 6. Lapatinib and OSU-03012 interact to activate the extrinsic apoptosis pathway. (A) GBM6 and GBM12 cells were treated with vehicle (DMSO) or with lapatinib (1 μM) and OSU-03012 (1 μM). Cells were fixed at the indicated time points (5–24h) and the plasma membrane levels of CD95 determined by immunohistochemistry. Data are presented as the –Fold increase in CD95 density (n = 3, ± SEM). (B) GBM6 cells were either transfected with siRNA to knock down CD95 expression or were infected with a virus to express c-FLIP-s. Twenty four h later cells were treated with vehicle (DMSO) or with lapatinib (1 μM) and OSU-03012 (1 μM). Cells were isolated 24h later and viability determined by trypan blue exclusion assay (n = 3 ± SEM). (C) Cells were infected with empty vector virus (CMV) or with viruses to express dominant negative caspase 9, BCL-XL or c-FLIP-s. Twenty four h later cells were treated with vehicle (DMSO) or with lapatinib (1 μM) and/or OSU-03012 (1 μM). Cells were isolated 24h later and viability determined by trypan blue exclusion assay (n = 3 ± SEM). (D) GBM5 and GBM12 cells were transfected with empty vector plasmid (CMV) or with a plasmid to express MCL-1. Twenty four h later cells were treated with vehicle (DMSO) or with lapatinib (1 μM) and/or OSU-03012 (1 μM). Cells were isolated 24h later and viability determined by trypan blue exclusion assay (n = 3 ± SEM). (E) GBM12 cells were transfected with scrambled siRNA (siSCR) or siRNA molecules to knock down the expression of NOXA, PUMA, BIK, BCL-XL, MCL-1 and BCL-XL + MCL-1. Twenty four h later cells were treated with vehicle (DMSO) or with lapatinib (1 μM) and OSU-03012 (1 μM). Cells were isolated 24h later and viability determined by trypan blue exclusion assay (n = 3 ±SEM). (F) GBM12 cells were transfected with scrambled siRNA (siSCR) or an siRNA molecule to knock down the expression of AIF. Twenty four h later cells were treated with vehicle (DMSO) or with lapatinib (1 μM) and/or OSU-03012 (1 μM). Cells were isolated 24h later and viability determined by trypan blue exclusion assay (n = 3 ± SEM). *p < 0.05 less than corresponding value in siSCR cells.
None
Figure 7. Lapatinib and OSU-03012 interact to increase a toxic form of autophagy. (A) GBM12 cells were transfected with a plasmid to express GFP-LC3. Twenty four h later cells were treated with vehicle (DMSO) or with lapatinib (1 μM) and/or OSU-03012 (1 μM). Cells were examined 24h later under a fluorescent microscope to determine the number of GFP punctae per cell from 40 cells (n = 3, ± SEM). (B) GBM12 cells were transfected with a plasmid to express GFP-LC3 and with siRNA molecules to knock down ERBB1 and/or ERBB2. Cells were examined 24h later under a fluorescent microscope to determine the number of GFP punctae per cell from 40 cells (n = 3, ± SEM). (C) DAOY cells were transfected with a plasmid to express GFP-LC3 and with siRNA molecules to knock down ERBB1 and/or ERBB4. Cells were examined 24h later under a fluorescent microscope to determine the number of GFP punctae per cell from 40 cells (n = 3, ± SEM). (D) GBM12 cells were transfected with siRNA molecules to knock down Beclin1 or ATG5. Twenty four h later cells were treated with vehicle (DMSO) or with lapatinib (1 μM) and/or OSU-03012 (1 μM). Cells were isolated 24h later and viability determined by trypan blue exclusion assay (n = 3 ± SEM).
None
Figure 8. OSU-03012 and lapatinib interact in vivo to suppress tumor growth. DAOY cells (1 × 10⁷) were injected into the rear flanks of athymic mice. Tumors formed over the following month (~200 mm3, per treatment group, day 0). Animals were doses with drugs: vehicle (DMSO and Cremophore); Lapatinib (100 mg/kg, BID); OSU-03012 (25 mg/kg QD) or both drugs combined. Tumor volumes were assessed by caliper on the indicated days (n = 2 experiments with 3 animals per group in each experiment: total 6 animals per group ± SEM). * p < 0.05 less than other treatment values.

References

    1. Hawkey CJ, Fortun PJ. Cyclooxygenase-2 inhibitors. Curr Opin Gastroenterol. 2005;21:660–4. - PubMed
    1. Kiefer W, Dannhardt G. Novel insights and therapeutical applications in the field of inhibitors of COX-2. Curr Med Chem. 2004;11:3147–61. - PubMed
    1. Kang SG, Kim JS, Park K, Kim JS, Groves MD, Nam DH. Combination celecoxib and temozolomide in C6 rat glioma orthotopic model. Oncol Rep. 2006;15:7–13. - PubMed
    1. Klenke FM, Gebhard MM, Ewerbeck V, Abdollahi A, Huber PE, Sckell A. The selective Cox-2 inhibitor Celecoxib suppresses angiogenesis and growth of secondary bone tumors: an intravital microscopy study in mice. BMC Cancer. 2006;6:9. doi: 10.1186/1471-2407-6-9. - DOI - PMC - PubMed
    1. Koehne CH, Dubois RN. COX-2 inhibition and colorectal cancer. Semin Oncol. 2004;31(Suppl 7):12–21. doi: 10.1053/j.seminoncol.2004.03.041. - DOI - PubMed

Publication types

MeSH terms

Substances