. 2012 Nov 28;31(23):4375-87.
doi: 10.1038/emboj.2012.267. Epub 2012 Sep 18.

Hrp3 controls nucleosome positioning to suppress non-coding transcription in eu- and heterochromatin

Affiliations

Hrp3 controls nucleosome positioning to suppress non-coding transcription in eu- and heterochromatin

Young Sam Shim et al. EMBO J. .

Abstract

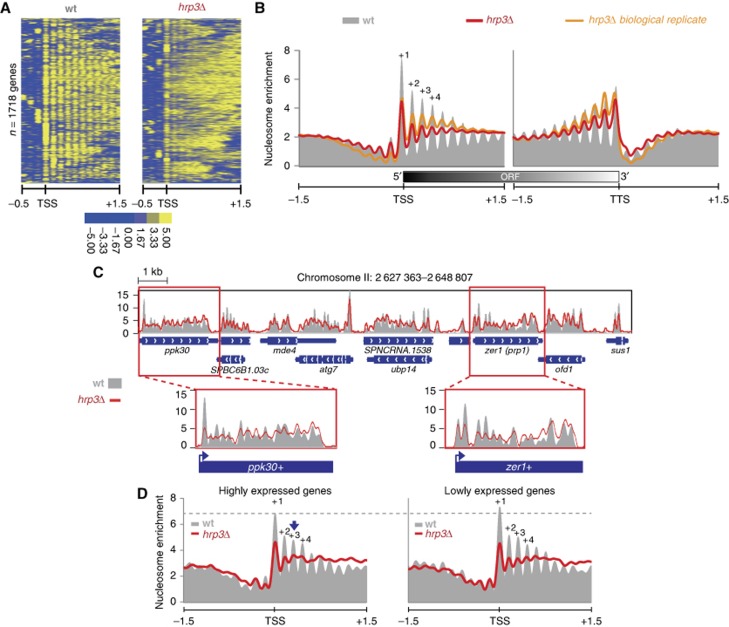
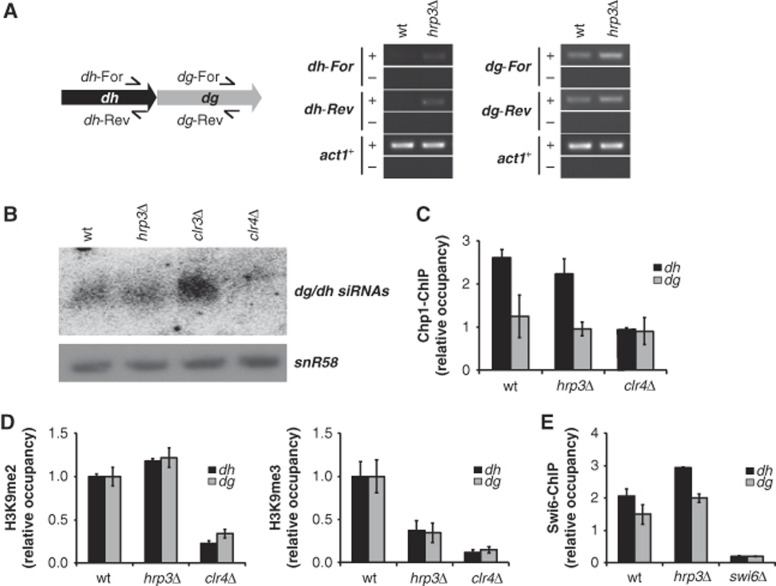
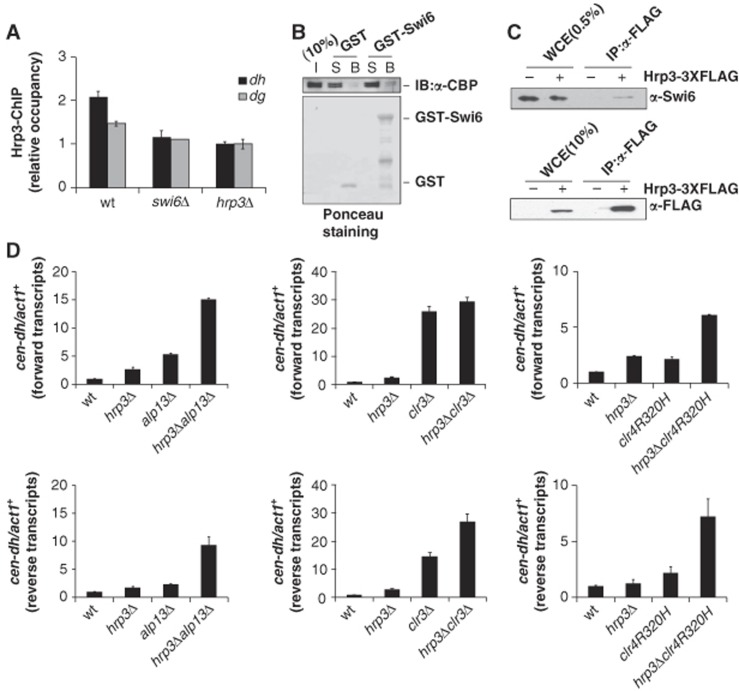
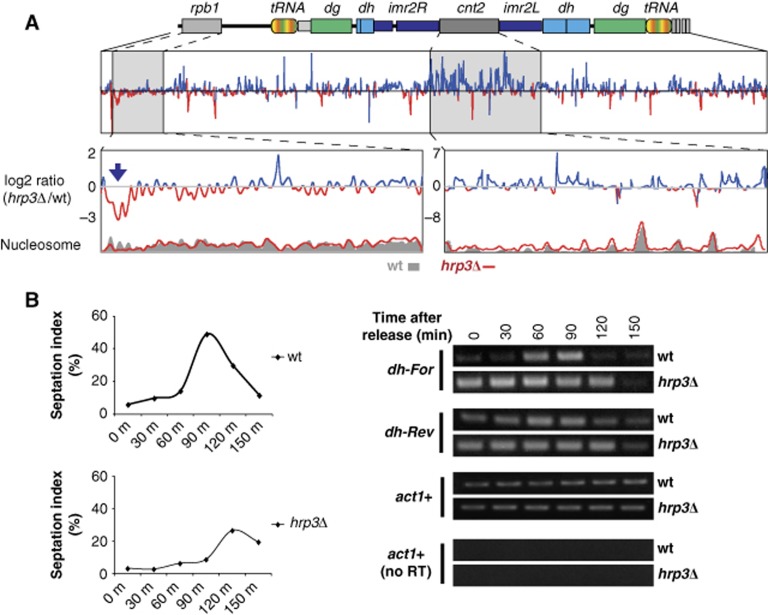
The positioning of the nucleosome by ATP-dependent remodellers provides the fundamental chromatin environment for the regulation of diverse cellular processes acting on the underlying DNA. Recently, genome-wide nucleosome mapping has revealed more detailed information on the chromatin-remodelling factors. Here, we report that the Schizosaccharomyces pombe CHD remodeller, Hrp3, is a global regulator that drives proper nucleosome positioning and nucleosome stability. The loss of Hrp3 resulted in nucleosome perturbation across the chromosome, and the production of antisense transcripts in the hrp3Δ cells emphasized the importance of nucleosome architecture for proper transcription. Notably, perturbation of the nucleosome in hrp3 deletion mutant was also associated with destabilization of the DNA-histone interaction and cell cycle-dependent alleviation of heterochromatin silencing. Furthermore, the effect of Hrp3 in the pericentric region was found to be accomplished via a physical interaction with Swi6, and appeared to cooperate with other heterochromatin factors for gene silencing. Taken together, our data indicate that a well-positioned nucleosome by Hrp3 is important for the spatial-temporal control of transcription-associated processes.


Conflict of interest statement

The authors declare that they have no conflict of interest.

Figures

Figure 1
Figure 1
Loss of Hrp3 disrupts nucleosome positioning within transcribed regions. (A) A heatmap shows patterns of nucleosome positions around 2-kb regions containing 1718 non-overlapping TSSs. A colour bar represents nucleosome density. (B) A nucleosome density graph illustrates nucleosome arrangements within 3-kb regions containing the TSSs and TTSs. The y axis indicates the level of normalized nucleosome enrichment (reads per million; RPM). This result was confirmed by using identical analysis with a biological replicate (right panel). (C) The nucleosome patterns at a 21-kb region in wild type and hrp3Δ. (D) Based on the expression profiling analysis (see Materials and methods), the top 200 and bottom 200 genes were regarded as highly expressed and lower expressed genes, respectively. Nucleosomes were aligned to 3-kb regions around the TSSs of the given gene set. These figures represent a single experiment.
Figure 2
Figure 2
Deletion of hrp3 produces antisense transcripts. (A) Expression profiling revealed that the deletion of hrp3 caused the generation of antisense transcripts. The signal intensity (cy5/cy3) of antisense transcripts was measured using microarrays. A total of 840 genes in chromosome II were examined, and the relative positions of the genes were preserved (x axis). A colour bar represents expression levels of antisense transcripts. (B) Strand-specific RT–PCR of RNAs isolated from wild-type and hrp3Δ cells. Single primers complementary to either forward or reverse transcripts were used to synthesize the cDNAs of zer1+ and act1+ (control). (C) Mutants were clustered according to the similarity of their antisense profiles (Pearson’s correlation and average linkage method). A set of microarray data for various genes (ago1Δ, clr4Δ, clr6Δ, pht1Δ, rrp6Δ, set2Δ, and swi6Δ) was obtained from the literature (Zofall et al, 2009; Zhang et al, 2011). A colour bar represents the Pearson’s correlation coefficient. (D) Several genes in the euchromatic region (chr2:1459011–1485370) show antisense transcripts in mutants (log2 of cy5/cy3). Red arrows indicate the genes that produced antisense transcripts. A colour bar represents expression levels of antisense transcripts. (E) The levels of antisense transcripts from convergent and non-convergent genes were measured. The average signal intensity (log2 of cy5/cy3 from both sense and antisense transcripts) per gene was calculated and converted to z-scores. P-values for paired t-tests (two-tailed) comparing mutants and wild-type (wt) antisense levels are indicated (*P<0.1, **P<0.01). Microarray results were generated in a single experiment. Figure source data can be found with the Supplementary data.
Figure 3
Figure 3
Hrp3 suppresses antisense transcription along with Set2 and Clr6 HDAC complex II. (A) The genome-wide levels of antisense transcripts in wild-type (wt), hrp3Δ, alp13Δ, and hrp3Δalp13Δ were calculated around the ORF regions (left panel). The genes showing significant expression of antisense transcripts (average log2 ratio >1.5) were counted in each sample (right panel). (B) The expression levels of sense (left panel) or antisense transcripts (right panel) corresponding to zer1+ in the indicated strains were analysed by RT–qPCR. All values were normalized to the expression level of act1+. The graphs show the amount of transcripts in each strain relative to that in the wild type. (C) ChIP analysis was performed with antibodies against H3, H3 Lys9 acetylation (H3K9Ac), and H3 Lys14 acetylation (H3K14Ac). The precipitated chromatin was amplified by qPCR using primers encompassing the promoter region, the middle region and the 3′ region of zer1+. The signals of H3K9Ac and H3K14Ac were normalized to that of H3. The graphs in the left and right panels show the occupancies of H3K9Ac/H3 and H3K14Ac/H3, respectively, in the mutants relative to those in wild type. Error bars in (B) and (C) represent the standard deviations from three independent experiments.
Figure 4
Figure 4
The ATPase activity of Hrp3 is required for nucleosome stability. (A) The remodelling activity of Hrp3 is important for suppressing antisense transcripts. Strand-specific RT–qPCR of the zer1+ and sod2+ genes was performed in Hrp3-3XFLAG and hrp3K406A-3XFLAG strains, as described in Figure 3B. The graphs show the amount of transcripts relative to those of Hrp3-3XFLAG. (B) Hrp3 does not affect the level of H3 occupancy in zer1+ (left panel) and sod2+ (right panel). ChIP analysis was performed with antibodies to H3 in wild type and hrp3Δ. The data represent the average of three independent experiments, and the error bars show the standard deviations. (C, D) Hrp3 affects the sensitivity of chromatin to salt-dependent disruption. Equal amounts of nuclei extracted from wild type and hrp3Δ (C), or Hrp3-3XFLAG and hrp3K406A-3XFLAG strains (D) were pelleted and resuspended in solutions of increasing NaCl concentration. The amount of insoluble H3 obtained following each salt wash was analysed by western blotting using α-H3 antibody. The graph depicts the amount of pelleted H3 normalized with respect to the amount of H3 obtained following the 0.2 M NaCl wash. Error bars indicate the standard deviations from three independent experiments. Figure source data can be found with the Supplementary data.
Figure 5
Figure 5
Hrp3 controls centromeric transcripts in an RNAi-independent manner. (A) The hrp3Δ mutant showed an increase in dh/dg transcripts. Transcripts derived from the forward (dh/dg-For) or reverse (dh/dg-Rev) strand of centromeric dg and dh were determined by RT–PCR, with actin (act1+) used as a loading control. ‘+’ indicates DNA generated through reverse transcription and ‘−’ indicates control omitting the RT step. (B) Deletion of hrp3 does not decrease the siRNAs corresponding to dg and dh repeats. siRNAs from each strain were analysed by northern blot analysis with a probe specific for dg/dh sequences. (C) hrp3Δ does not affect the localization of the RITS subunit, Chp1, at dh/dg regions. ChIP experiments were performed using antibodies against Chp1. The graph shows the relative occupancy of Chp1 normalized with respect to the results obtained in the clr4Δ mutant. (D) H3K9 tri-methylation is significantly decreased in the hrp3Δ mutant. H3K9me2 and H3K9me3 levels at dh/dg regions in wild-type and hrp3Δ strains were examined by ChIP using antibodies specific for H3K9me2 and H3K9me3. The clr4Δ strain was used as a negative control. The graphs show the occupancies of H3K9me2 (left panel) and H3K9me3 (right panel) in the mutant relative to those in wild-type cells. (E) hrp3Δ does not affect the localization of Swi6 at dh/dg regions. ChIP experiments were performed using antibodies against the Swi6. The relative occupancy of Swi6 was normalized with respect to the results obtained in swi6Δ cells. The error bars in (CE) represent the standard deviations from three independent experiments. Figure source data can be found with the Supplementary data.
Figure 6
Figure 6
Hrp3 acts together with other heterochromatin factors. (A) The occupancy of Hrp3 at dh/dg regions is affected by Swi6. ChIP experiments were performed using antibodies against Hrp3. The relative occupancy of Hrp3 was normalized with respect to the results obtained in hrp3Δ cells. The error bars represent the standard deviations from three independent repeats. (B) Hrp3 physically interacts with Swi6. GST-Swi6 or GST alone was incubated with TAP-purified Hrp3, and TAP-tagged Hrp3 was detected by western blotting using α-CBP antibody. The input lane (I) contains 10% of the amount of Hrp3 protein used in the binding assay. Lanes labelled (S) contain 10% of the unbound material recovered after incubation of the TAP-tagged Hrp3 with GST-Swi6 or GST. Lanes labelled (B) show the bound TAP-tagged Hrp3. Ponceau staining is shown in the bottom panel. (C) Hrp3 interacts with Swi6 in vivo. Cells carrying Hrp3-3XFLAG were extracted and precipitated with α-FLAG M2 agarose resin, and immunoprecipitated fractions were analysed by western blotting with α-Swi6 antibody. The lane labelled ‘WCE for Swi6 detection’ contained the equivalent of 0.5% of the input protein, while ‘WCE for Hrp3-3XFLAG detection’ contained 10% of the input. (D) Hrp3 acts cooperatively with other TGS factors and Clr4 to control centromeric repeat transcription. Transcripts derived from the forward (upper) or reverse (lower) strands of centromeric dh were determined with RT–qPCR. All values were normalized with respect to the expression of act1+. The error bars indicate standard deviations from three independent experiments. Figure source data can be found with the Supplementary data.
Figure 7
Figure 7
hrp3Δ perturbs nucleosome position at centromeric regions, and alleviates cell cycle-dependent heterochromatin silencing. (A) The absence of Hrp3 causes nucleosome perturbation on both heterochromatic and euchromatic regions near the centromere on chromosome II. The blue arrow indicates a region showing lower nucleosome occupancy in hrp3Δ compared to wild type. The relative level of nucleosome density (log2 ratio) between hrp3Δ and wild type (wt) was calculated using a sliding window approach (50 bp). High and low occupancies of nucleosomes in hrp3Δ compared to wild type are indicated by the blue and red lines, respectively. (B) Centromeric dh repeats are constitutively transcribed in hrp3Δ. RNAs were isolated from synchronized cdc25-22 and cdc25-22 hrp3Δ cells, and transcripts corresponding to the forward (cen For) or reverse (cen Rev) strand of the centromeric dh repeat were assayed using strand-specific RT–PCR. Actin (act1+) was used as a loading control. The septation index (right panel) was used to monitor cell-cycle progression. Figure source data can be found with the Supplementary data.

Comment in

Similar articles

Cited by

References

    1. Anderson HE, Wardle J, Korkut SV, Murton HE, Lopez-Maury L, Bahler J, Whitehall SK (2009) The fission yeast HIRA histone chaperone is required for promoter silencing and the suppression of cryptic antisense transcripts. Mol Cell Biol 29: 5158. - PMC - PubMed
    1. Bernardi F, Koller T, Thoma F (1991) The ade6 gene of the fission yeast Schizosaccharomyces pombe has the same chromatin structure in the chromosome and in plasmids. Yeast 7: 547–558 - PubMed
    1. Cam HP, Sugiyama T, Chen ES, Chen X, FitzGerald PC, Grewal SIS (2005) Comprehensive analysis of heterochromatin-and RNAi-mediated epigenetic control of the fission yeast genome. Nat Genet 37: 809–819 - PubMed
    1. Carrozza MJ, Li B, Florens L, Suganuma T, Swanson SK, Lee KK, Shia W-J, Anderson S, Yates J, Washburn MP, Workman JL (2005) Histone H3 methylation by Set2 directs deacetylation of coding regions by Rpd3S to suppress spurious intragenic transcription. Cell 123: 581–592 - PubMed
    1. Chandrasekharan M, Huang F, Sun Z (2009) Ubiquitination of histone H2B regulates chromatin dynamics by enhancing nucleosome stability. Proc Natl Acad Sci USA 106: 16686. - PMC - PubMed

Publication types

MeSH terms