. 2012 Nov 14;31(22):4276-88.
doi: 10.1038/emboj.2012.250. Epub 2012 Sep 18.

Hypothalamic AgRP-neurons control peripheral substrate utilization and nutrient partitioning

Affiliations

Hypothalamic AgRP-neurons control peripheral substrate utilization and nutrient partitioning

Aurélie Joly-Amado et al. EMBO J. .

Abstract

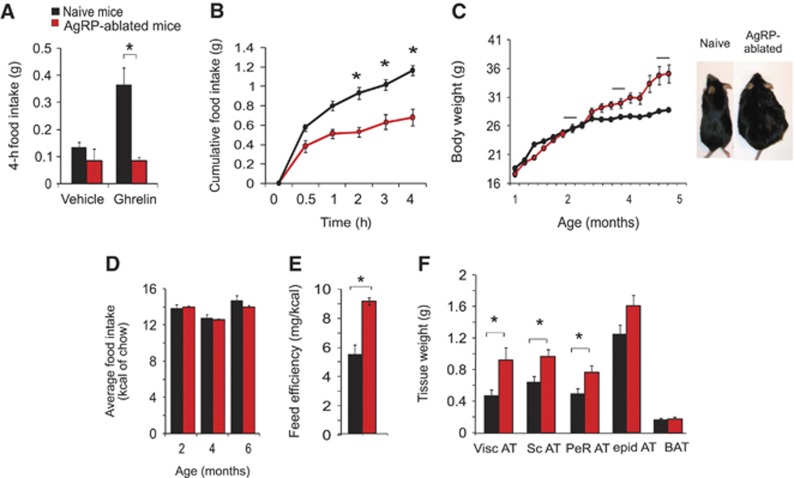
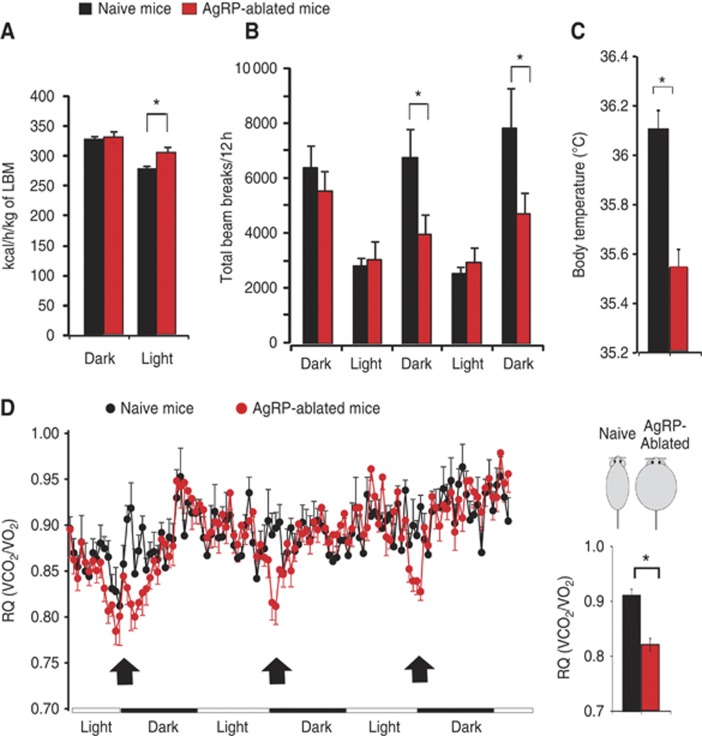
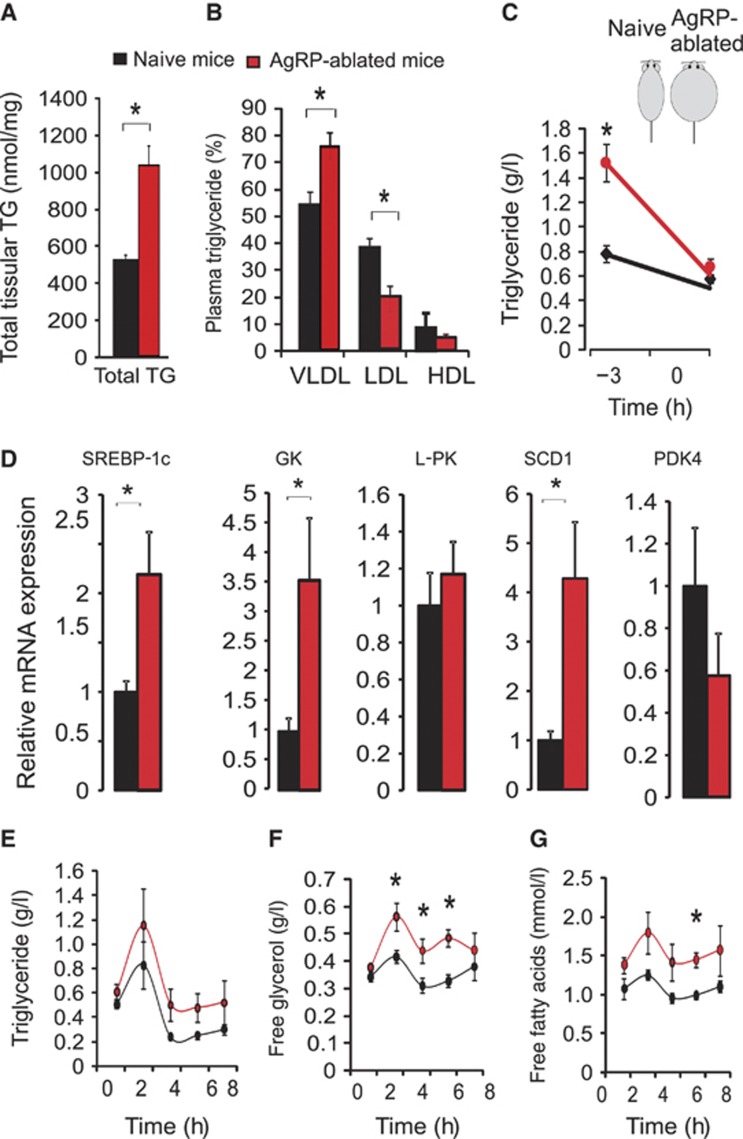
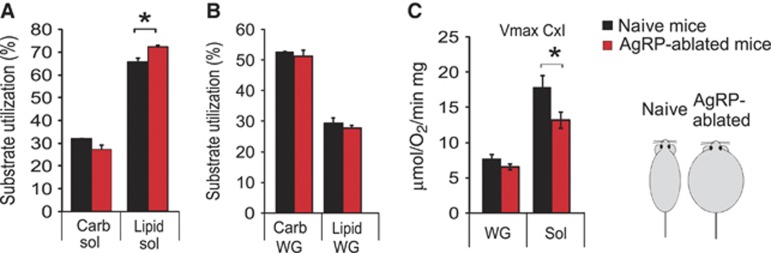
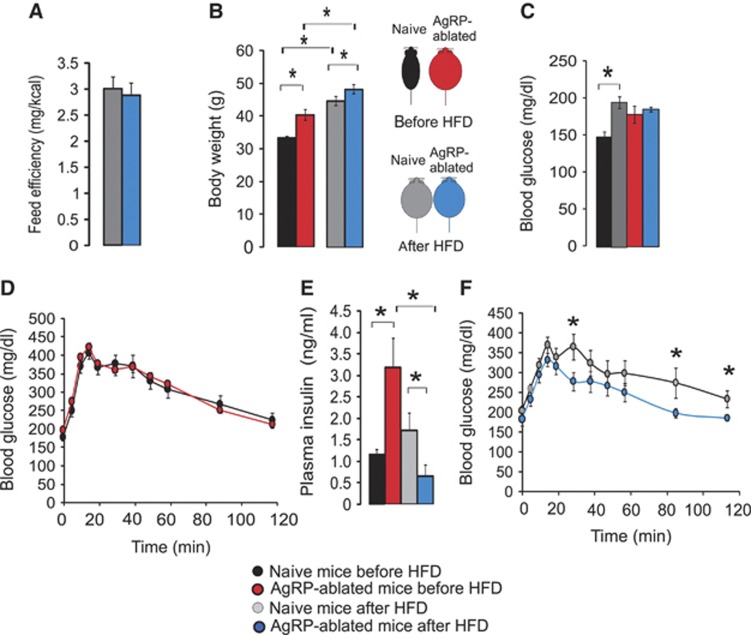
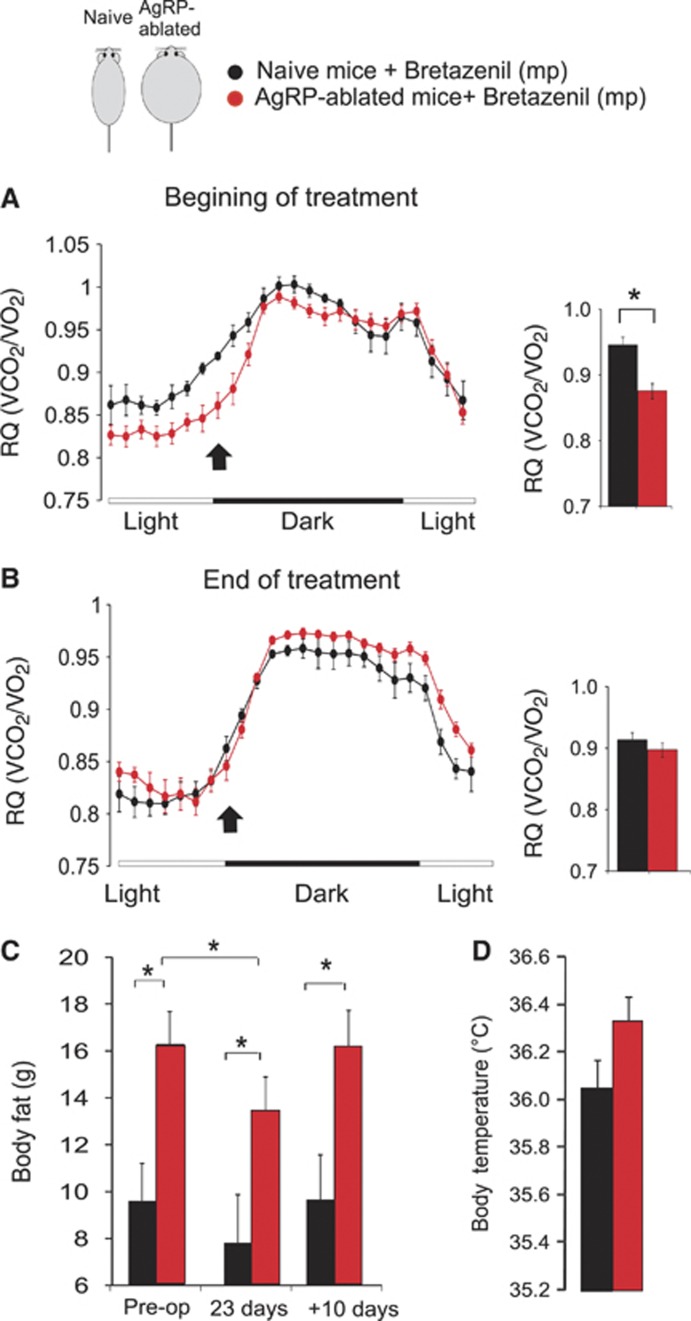
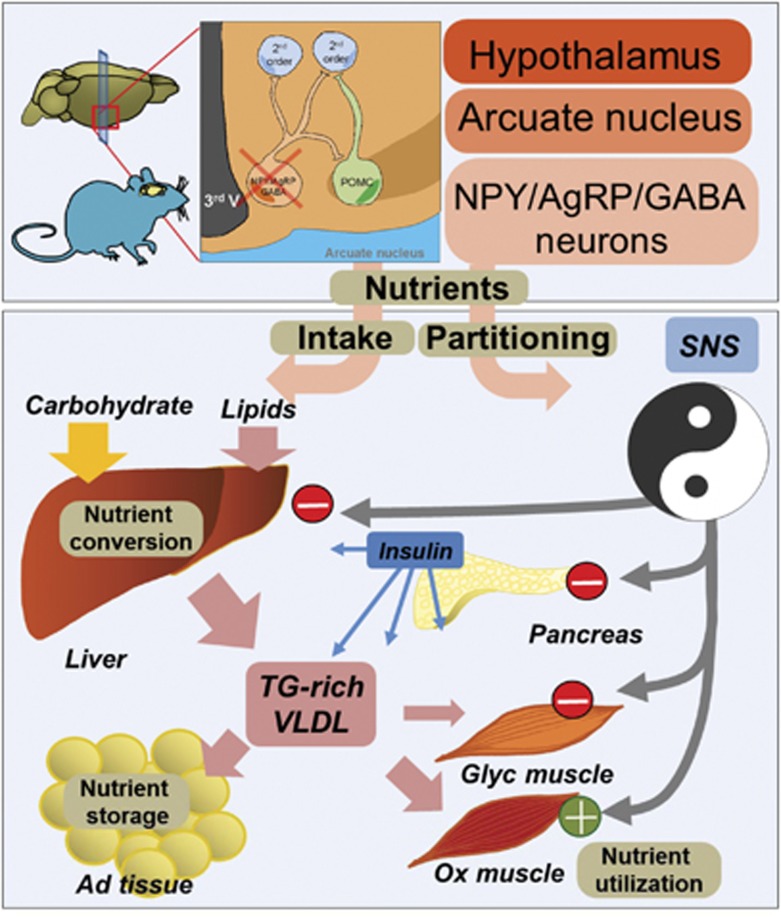
Obesity-related diseases such as diabetes and dyslipidemia result from metabolic alterations including the defective conversion, storage and utilization of nutrients, but the central mechanisms that regulate this process of nutrient partitioning remain elusive. As positive regulators of feeding behaviour, agouti-related protein (AgRP) producing neurons are indispensible for the hypothalamic integration of energy balance. Here, we demonstrate a role for AgRP-neurons in the control of nutrient partitioning. We report that ablation of AgRP-neurons leads to a change in autonomic output onto liver, muscle and pancreas affecting the relative balance between lipids and carbohydrates metabolism. As a consequence, mice lacking AgRP-neurons become obese and hyperinsulinemic on regular chow but display reduced body weight gain and paradoxical improvement in glucose tolerance on high-fat diet. These results provide a direct demonstration of a role for AgRP-neurons in the coordination of efferent organ activity and nutrient partitioning, providing a mechanistic link between obesity and obesity-related disorders.


Conflict of interest statement

The authors declare that they have no conflict of interest.

Figures

Figure 1
Figure 1
Mice lacking AgRP-neurons become obese on RCD. In all, 4-h feeding response after an intraperitoneal (IP) injection of saline or ghrelin (500 μg/kg) (A), or after a 24-h fast (B) in naive (black bars and circles) and AgRP-ablated mice (red bars and circles). (n=6–9 in each group). Average body weight in naive (black circles) and AgRP-ablated mice (red circles) fed on RCD (n=6–7 in each group) (C). Average food intake in kcal of chow was recorded at several time points at age 2, 4 and 6 months (black bar in Figure 1C) (n=6–7 in each group) (D). Feed efficiency is presented as mg of body weight gain/kcal consumed during a 4-month period (E). Adipose tissue weight after a 24-h fast (Visc AT: visceral adipose tissue, Sc AT: subcutaneous adipose tissue, Perirenal AT: perirenal adipose tissue, epid AT: epididymal adipose tissue) (F). Displayed values are mean values±s.e.m. *P<0.05 (n=6–7 in each group).
Figure 2
Figure 2
Metabolic shift towards lipid oxidation and modified energy expenditure is associated with obesity in mice lacking AgRP-neurons. Energy expenditure (kcal/h/kg of LBM) (A), total locomotor activity (B), average daily subcutaneous temperature (C) (*P<0.05 using linear regression model), daily variation of RQ analysis (VCO2/VO2) and average value for RQ (histogram) at the time period indicated with an arrow (D) (Figure 2C) (*P<0.05 using repeated measure ANOVA). Data were acquired on 6-month-old lean naive animals (black bars and black circles) and obese AgRP-ablated (red bar and red circles) (n=6 in each group). Displayed values are mean values±s.e.m. *P<0.05.
Figure 3
Figure 3
The lack of AgRP-neurons is associated with a change in the distribution of SNS output onto peripheral tissues that precedes obesity. Representative immunohistochemistry for c-fos in naive (left) and AgRP-ablated mice (right) after a 48-h fast in the ARC and the PVN of the hypothalamus. Scale bar=100 μm (A). Representative decrease in tissue NE content after α-MPT injection (upper panel) and, turnover rate (TR) (lower panel in histogram) (BE) were determined on pancreas (B), liver (C), white glycolytic muscle EDL (D) and red oxidative muscle soleus (Sol) (E). Plasma insulin levels after 5-h food deprivation were measured prior (time=0) and 30 min after an intraperitoneal injection of the α2-adrenergic receptor agonist clonidine (50 nmol/kg of body weight) (F, G). (AF) All measurements were acquired on lean naive (black bar and black circles) and lean AgRP-ablated mice (red bar and red circles) at a time point that preceded obesity (n=5–8 in each group) while Figure 3G present plasma insulin change after clonidine injection in lean naive and obese AgRP-ablated mice after obesity has established (G) (n=6–8 in each group). Displayed values are mean values±s.e.m. *P<0.05.
Figure 4
Figure 4
The lack of AgRP-neurons conveys an increased hepatic liver lipid production associated with increased lipid utilization. Liver TG quantification (total TG) (A) and plasma TG distribution (B) (in %) in circulating VLDL, LDL, HDL, respectively, in lean naive mice (black bar) compared with obese AgRP-ablated mice (red bar) after a 24-h fast. Plasma TG content prior (time=−3 h) and after (time=0) a 3-h food deprivation (C) at the beginning of the light period on lean naive (black circles) and obese-ablated mice (red circles). Total liver RNA was extracted and analysed by qRT–PCR for SREBP-1c, GK, L-PK (L-pyruvate kinase), SCD1 (stearoyl CoA desaturase 1) and PDK4 (pyruvate dehydrogenase isozyme kinase 4) after a 24-h fast (D). Plasma TG (g/l) (E), free glycerol (g/l) (F) and FFAs (mmol/l) (G) in lean naive mice (blacks circles) and obese AgRP-ablated mice (red circles) after an oral charge of lipid (15 μl/g of body weight of olive oil) at time=0. Displayed values are mean values±s.e.m. *P<0.05.
Figure 5
Figure 5
Ablation of AgRP-neurons leads to an increase in lipid-substrate utilization in oxidative muscle mitochondria. Mitochondrial respiration rates measured in permeabilized fibres for carbohydrate substrate (pyruvate) or lipid utilization presented in percentage of the maximal respiration measured with glutamate in soleus muscle (sol) (A) and white fast gastrocnemius (WG) (B) in lean naive mice (black bar) and obese AgRP-ablated mice (red bar) fed a RCD. Mitochondrial respiration rates with complex I substrates (C) in white gastrocnemius (WG) and soleus muscles (Sol) (n=6 in each group). Displayed values are mean values±s.e.m. *P<0.05.
Figure 6
Figure 6
Lack of AgRP-neurons is associated with resistance to high-fat feeding. Feed efficiency as mg of body weight gain/kcal consumed calculated during a 2-month period during an HFD regimen (A), final body weight (B), blood glucose (mg/dl) after a 5-h food deprivation (C) and after an oral charge of glucose (3 g/kg) (D, F) and plasma insulin (ng/ml) (E), in naive mice (black and grey bars) and obese AgRP-ablated mice (red and blue bars). Data were acquired on the same group of animals fed a RCD before HFD regimen (black and red bars), and after a 6-month HFD regimen (grey and blue) (n=7–8 in each group). Displayed values are mean values±s.e.m. *P<0.05.
Figure 7
Figure 7
Chronic GABAA-receptor agonist treatment normalizes the phenotype of AgRP-ablated mice. Representative distribution of RQ (VCO2/VO2) acquired by indirect calorimetry on the course of several days in naive (black circles) and obese AgRP-ablated mice (red circles) implanted with subcutaneous osmotic minipumps (mp) delivering the GABAA receptor partial agonist, bretazenil (0.25 μl/h; 3 mg/ml) (A, B). Data are presented as an average of 2 (A) or 3 (B) consecutive days acquired at the beginning (A) or during (B) the treatment. Average RQ value at the entry of the dark cycle, at a time indicated with an arrow, are presented as histogram (*P<0.05 using repeated measure ANOVA). Body fat content acquired by NMR in (C) on naive (black bars) and obese AgRP-ablated mice (red bars) prior to mp implantation (pre-op), during bretazenil delivery (at day=23) or 10 days after the mp have run out (n=5–7 in each group). Average daily subcutaneous temperature collected on 3 consecutive days during bretazenil treatment (D). Displayed values are mean values±s.e.m. *P<0.05.
Figure 8
Figure 8
Schematic overview summarizing the consequences of AgRP-neurons depletion on nutrient conversion, storage and utilization. Lack of AgRP-neurons affects food intake and promotes a change in SNS outflow onto peripheral tissues. Whereas SNS outflow is decreased in pancreas, liver and white glycolytic extensor digitorum longum (EDL) muscle, it is increased in oxidative soleus muscle. These changes are associated with increased nutrient conversion, lipid synthesis and export in the liver, and an enhanced preference for lipid substrate in red muscle. Adipose gain results from increased insulin level and sustains adipose expendability and storage capabilities. The overall consequence of increased ratio of fat/carbohydrate oxidation is associated with improved glucose tolerance in mice lacking AgRP-neurons after an HFD.

Comment in

References

    1. Ahima RS, Antwi DA (2008) Brain regulation of appetite and satiety. Endocrinol Metab Clin North Am 37: 811–823 - PMC - PubMed
    1. Ahren B (2000) Autonomic regulation of islet hormone secretion—implications for health and disease. Diabetologia 43: 393–410 - PubMed
    1. Ahren B, Taborsky G, Porte D (1986) Neuropeptidergic versus cholinergic and adrenergic regulation of islet hormone secretion. Diabetologia 29: 827–836 - PubMed
    1. Aponte Y, Atasoy D, Sternson SM (2011) AGRP neurons are sufficient to orchestrate feeding behavior rapidly and without training. Nat Neurosci 14: 351–355 - PMC - PubMed
    1. Bewick GA, Gardiner JV, Dhillo WS, Kent AS, White NE, Webster Z, Ghatei MA, Bloom SR (2005) Post-embryonic ablation of AgRP neurons in mice leads to a lean, hypophagic phenotype. FASEB J 19: 1680–1682 - PubMed

Publication types