. 2012 Nov;223(3):321-40.
doi: 10.1007/s00221-012-3262-x. Epub 2012 Sep 19.

Influence of anti-Nogo-A antibody treatment on the reorganization of callosal connectivity of the premotor cortical areas following unilateral lesion of primary motor cortex (M1) in adult macaque monkeys

Affiliations

Influence of anti-Nogo-A antibody treatment on the reorganization of callosal connectivity of the premotor cortical areas following unilateral lesion of primary motor cortex (M1) in adult macaque monkeys

Adjia Hamadjida et al. Exp Brain Res. 2012 Nov.

Abstract

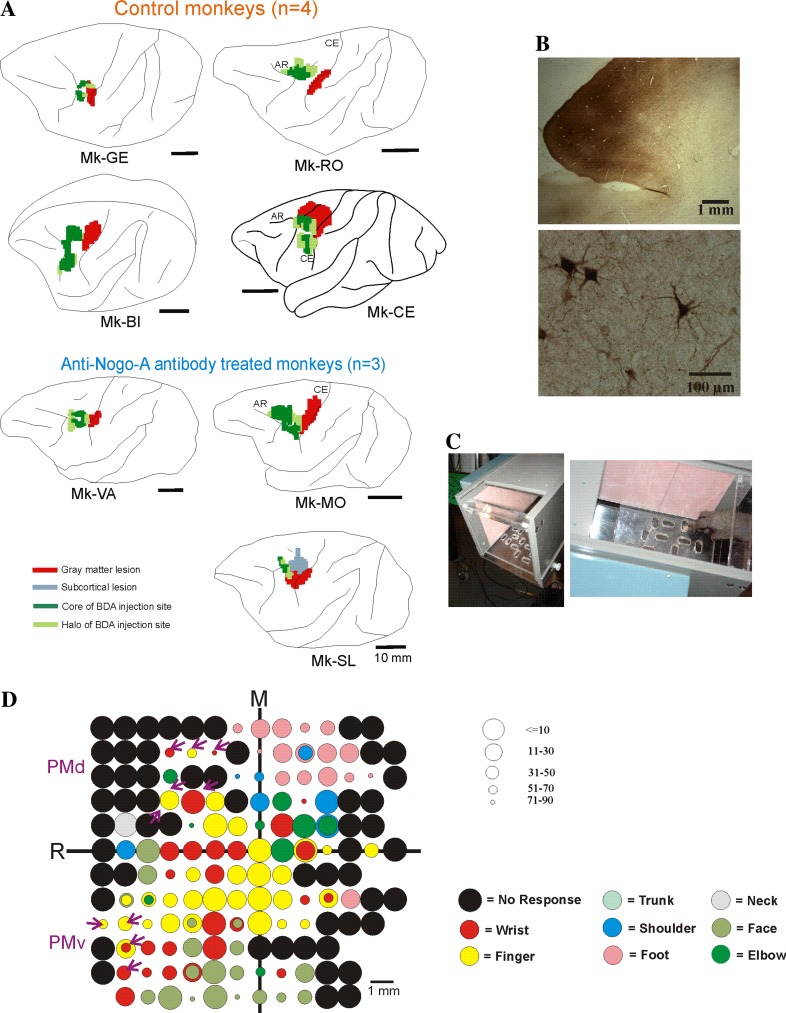
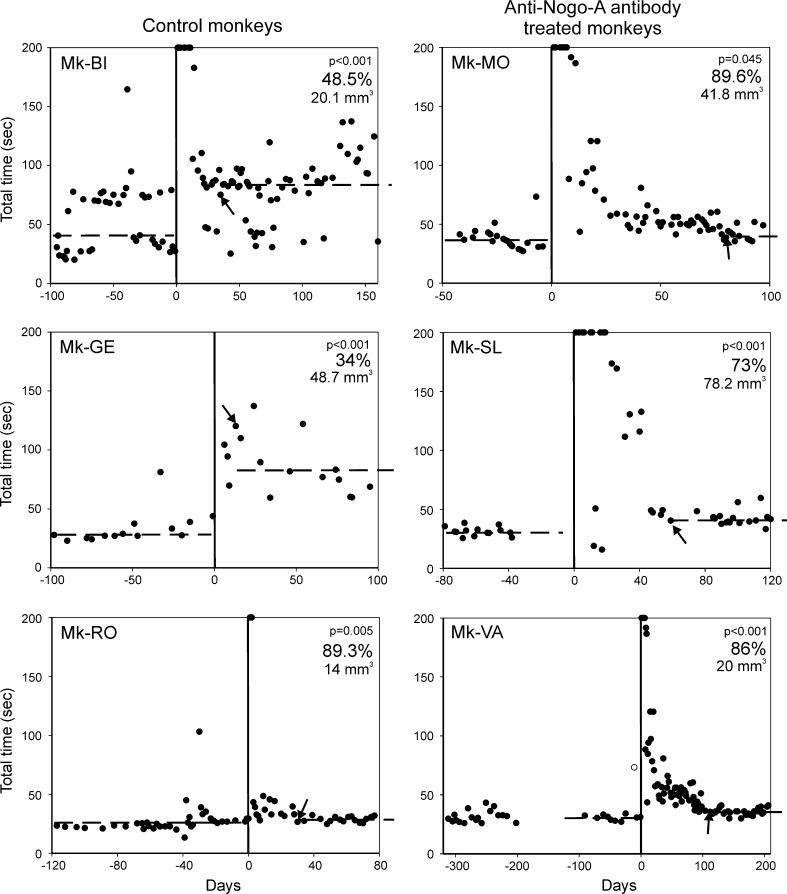
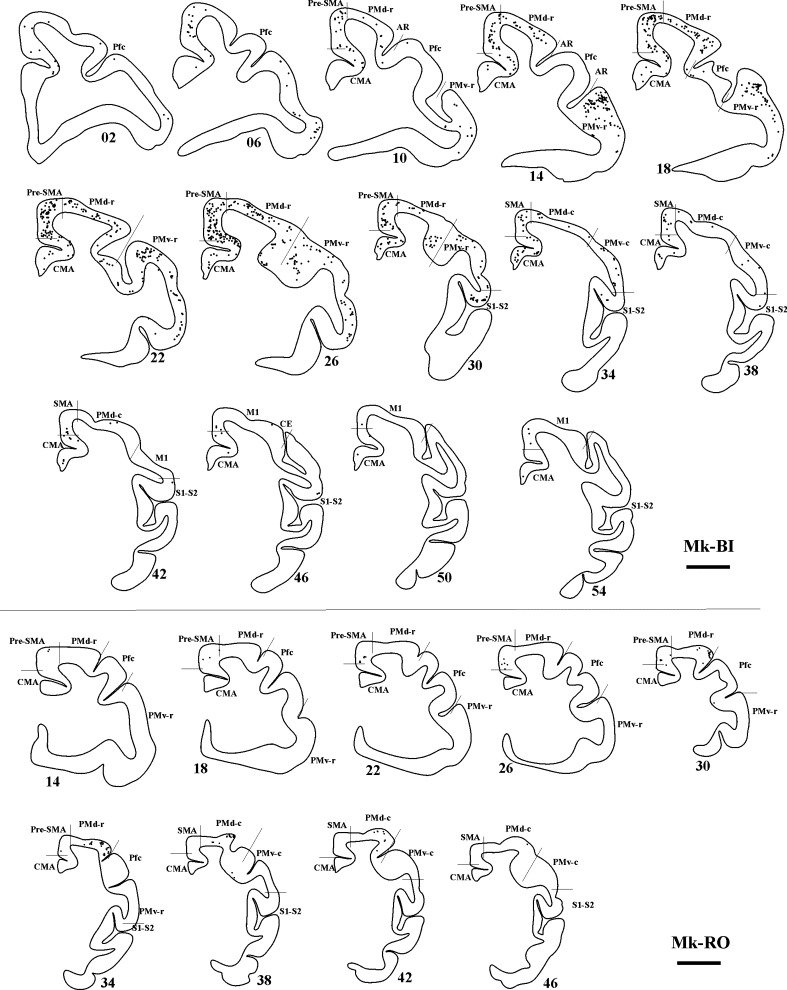
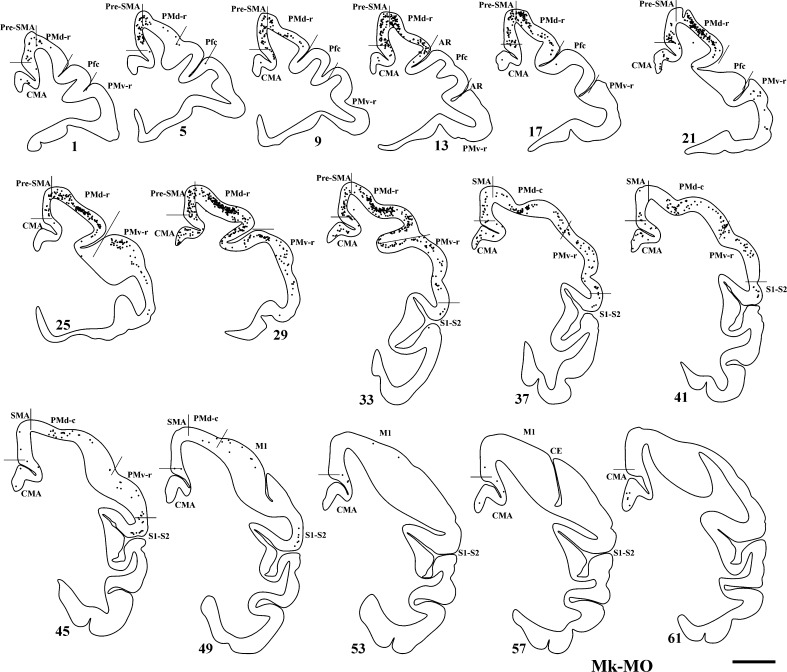
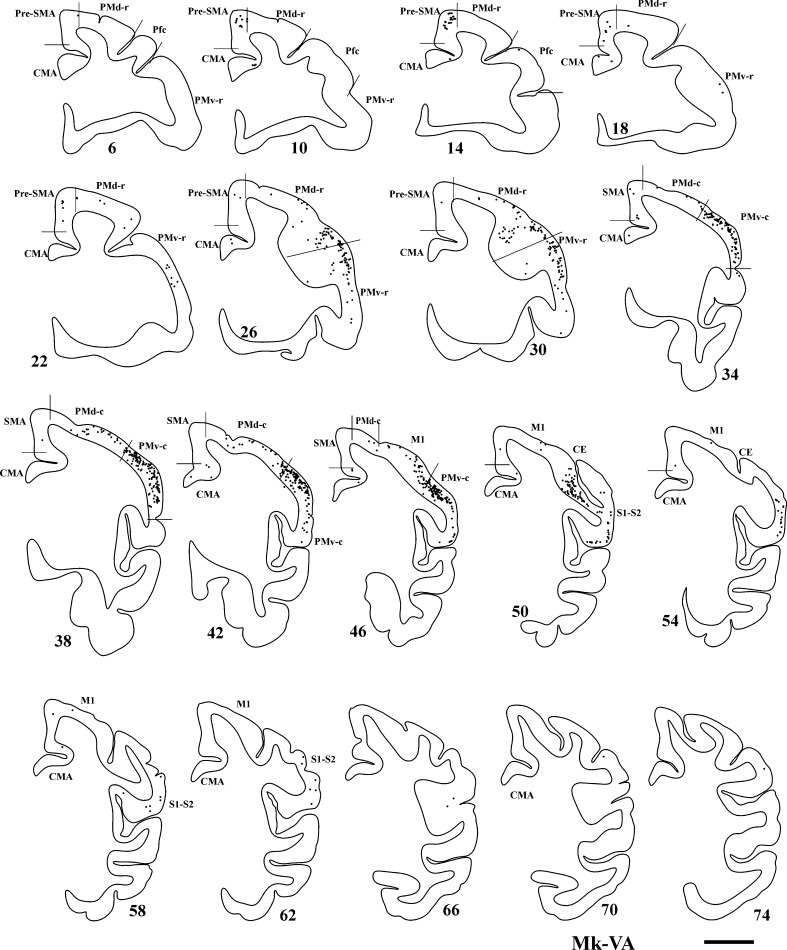
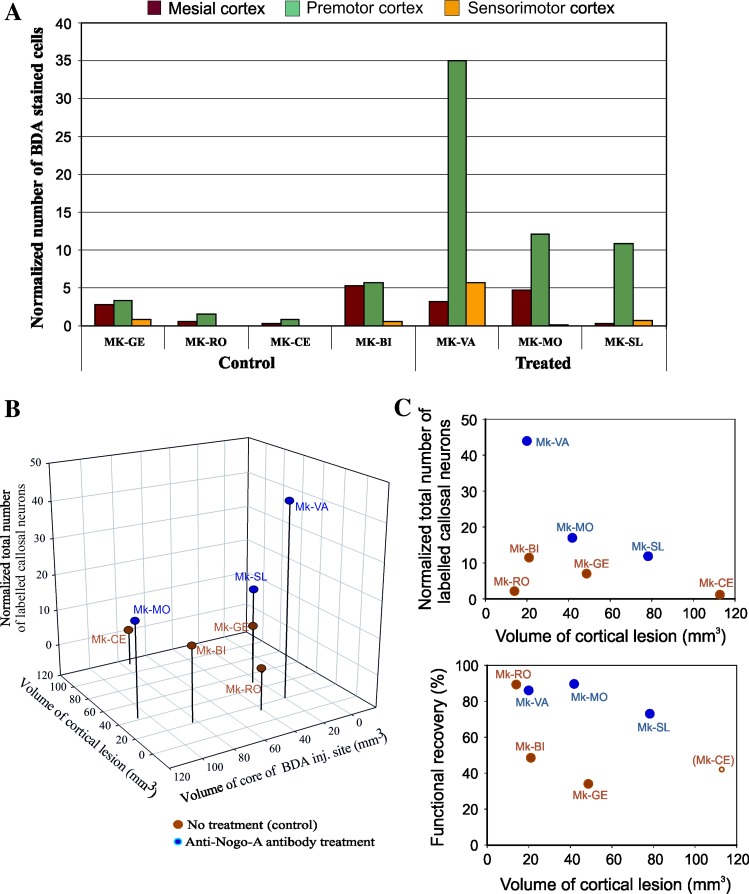
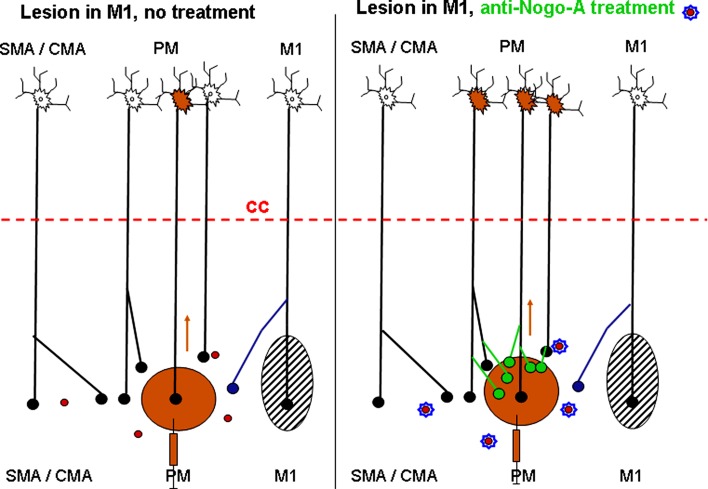
Following unilateral lesion of the primary motor cortex, the reorganization of callosal projections from the intact hemisphere to the ipsilesional premotor cortex (PM) was investigated in 7 adult macaque monkeys, in absence of treatment (control; n = 4) or treated with function blocking antibodies against the neurite growth inhibitory protein Nogo-A (n = 3). After functional recovery, though incomplete, the tracer biotinylated dextran amine (BDA) was injected in the ipsilesional PM. Retrogradely labelled neurons were plotted in the intact hemisphere and their number was normalized with respect to the volume of the core of BDA injection sites. (1) The callosal projections to PM in the controls originate mainly from homotypic PM areas and, but to a somewhat lesser extent, from the mesial cortex (cingulate and supplementary motor areas). (2) In the lesioned anti-Nogo-A antibody-treated monkeys, the normalized number of callosal retrogradely labelled neurons was up to several folds higher than in controls, especially in the homotypic PM areas. (3) Except one control with a small lesion and a limited, transient deficit, the anti-Nogo-A antibody-treated monkeys recovered to nearly baseline levels of performance (73-90 %), in contrast to persistent deficits in the control monkeys. These results are consistent with a sprouting and/or sparing of callosal axons promoted by the anti-Nogo-A antibody treatment after lesion of the primary motor cortex, as compared to untreated monkeys.


Figures

Fig. 1
Fig. 1
a Reconstruction on a lateral view of the left hemisphere in each monkey of the location and extent of the lesion aimed at the M1 hand representation (red territory) and BDA injection sites (territory in dark green for the core of the injection site and light green for the halo), as seen in transparency of the cortical surface. The actual volume of the lesions and BDA injections sites are given in Fig. 6b and Table 1. Mk-LA is not shown as it was excluded from the neuroanatomical analysis (see Table 1). b Photomicrograph of a typical BDA injection site in PMd and resulting BDA retrogradely labelled callosal cells in the opposite hemisphere. c View of the “Brinkman box” used for behavioural assessment of manual dexterity, representing a variation in our modified Brinkman board task (see text). The left picture shows the open facet of the “box” allowing access to the 20 wells, in which the pellets are placed. The right picture shows that “box” from above with the monkey’s hand aimed to a well filled with a pellet to be grasped using the precision grip between the index finger and the thumb. At the beginning of the test, the 20 wells are each filled with a pellet. As the top facet of the “box” is transparent, the hand movements are executed under visual control. The behavioural test was taped with a video camera placed below the “box”. d Raw ICMS map established post-lesion in Mk-BI, as it represented the basis to identify positions where to perform penetrations with the syringe to infuse muscimol in PMd or PMv and then injections of BDA. Along the axes, “R” is for rostral and “M” is for medial. The circles represent the positions of electrodes penetrations for ICMS on the cortical surface, with colour code to represent the body territory activated at the lowest threshold along the corresponding electrode penetration. The threshold value is given by the size of the circle in microAmps (see on the right of the ICMS map). Circles comprising 2 colours are for ICMS electrode penetrations along which 2 body territories were activated at comparable threshold values. The purple arrows are for the sites of infusion of muscimol in PMd or in PMv, which were then used also as sites for BDA injections. Six sites of BDA injections were selected in PMd and 5 sites in PMv. BDA was injected in PMd and in PMv at sites where digits were activated by ICMS (yellow circles), or at sites where ICMS elicited at lowest threshold a wrist movement (red circles). In the latter case (wrist representation), there was also some ICMS effect on the digits, but at higher threshold. Note in M1 the presence of a few ICMS sites where digits movements were elicited at low intensity, but much fewer than on the pre-lesion ICMS map (not shown). Note also the presence of numerous non-micro-excitable sites, typical of the post-lesion ICMS map
Fig. 2
Fig. 2
Behavioural data showing the manual dexterity of six monkeys before the lesion (negative days on the abscissa) and post-lesion (positive days on the abscissa). The day of the lesion (day zero) is indicated by a vertical line. Each dot value corresponds to the total time (in seconds) needed by the monkey in a given session to empty the board containing 20 wells using the contralesional hand (see Fig. 1c). The median total time pre-lesion is given by the horizontal dashed line on the left part of each graph. Note the dramatic increase in total time immediately after the lesion, reflecting the deficit (increased difficulty to grasp the pellet using the precision grip). The values saturated at 200 correspond to sessions immediately post-lesion in which the monkey was unable to complete the task (empty the 20 wells). Then, there is a progressive recovery of manual dexterity. The recovery was considered as complete on the day indicated by the arrow, corresponding to the time point at which the monkey reached a plateau in the modified Brinkman board task (see Kaeser et al. 2010, 2011). The median total time at plateau of recovery is indicated by the horizontal dashed line on the right. In all monkeys, the post-lesion median total time was significantly longer than the pre-lesion median total time (p value given for each graph). The percentage of functional recovery was calculated by dividing the pre-lesion median total time by the post-lesion median total time at plateau, multiplied by 100. The percentage of functional recovery is given in each graph. For the interpretation of the data (see text), the volume of the cortical lesion in mm3 is indicated also in the graphs for each monkey. Note that Mk-BI exhibited a peculiar, bimodal behavioural pattern for this manual dexterity task, present, however, both pre-lesion and post-lesion: in some daily sessions, the monkey completed the task quickly (in about 25 s pre-lesion), whereas in other daily sessions, it took clearly more time (about 70–80 s pre-lesion as well). As the same bimodal distribution of total times was maintained post-lesion, it allows comparison of the median values. In line with a higher median value observed post-lesion for Mk-BI, note that for each of the two behavioural patterns, the variability across daily sessions was larger post-lesion as compared to pre-lesion, suggesting that the monkey was less regular and less comfortable with the task after the lesion. Moreover, pre-lesion Mk-BI exhibited the “quick” and the “slow” behaviours in equal proportions (50/50 %). After lesion (at plateau), the “slow” behaviour was more frequently present (73 % of the daily sessions) than the “quick” behaviour (27 %), also supporting the strong deficit induced by the lesion
Fig. 3
Fig. 3
Top panel Frontal sections of the right hemisphere in Mk-BI (control, untreated monkey), arranged from rostral to caudal, showing the distribution of retrogradely labelled callosal neurons as a result of BDA injection in the opposite PM. The number next to each reconstruction is the serial number of the corresponding histological section. Scale bar 5 mm. P principal sulcus, AR arcuate sulcus, CE central sulcus. Bottom panel Frontal sections of the right hemisphere in Mk-RO (control monkey), arranged from rostral to caudal, showing the distribution of retrogradely labelled callosal neurons as a result of BDA injection in the opposite PM. Same conventions as in top panel
Fig. 4
Fig. 4
Frontal sections of the right hemisphere in Mk-MO (anti-Nogo-A antibody-treated monkey), arranged from rostral to caudal, showing the distribution of retrogradely labelled callosal neurons as a result of BDA injection in the opposite PM. Scale bar 5 mm. Same conventions as in Fig. 3
Fig. 5
Fig. 5
Frontal sections of the right hemisphere in Mk-VA (anti-Nogo-A antibody-treated monkey), arranged from rostral to caudal, showing the distribution of retrogradely labelled callosal neurons as a result of BDA injection in the opposite PM. Same conventions as in Fig. 3
Fig. 6
Fig. 6
a Normalized number of BDA-labelled callosal neurons in the two groups of monkeys, observed in the intact hemisphere, in each case and across three main cortical zones (premotor cortex, mesial cortex and sensorimotor cortex). See text for the description of the procedure of normalization with respect to the volume of BDA injection site (core). b 3D plot showing the relationship of the normalized total number of labelled callosal neurons with the lesion volume and the volume of the core of the BDA injection sites (see text). c Two correlation plots illustrate the relationship between the normalized total number of BDA-labelled cells as a function of lesion extent (top graph) and between the functional recovery as a function of lesion extent (bottom graph). The colour code is the same as for b. In the bottom graph, the functional recovery in percent are the same values as indicated in Fig. 2, as derived from the Brinkman box task, except for Mk-CE (empty symbol). Mk-CE did not perform the Brinkman box task (see text), but the “modified Brinkman board” task. The latter test is generally less challenging than the Brinkman box task (Schmidlin et al. 2011). Consequently, the functional recovery value indicated for Mk-CE based on the “modified Brinkman board” task is higher than what would have been expected if Mk-CE would have performed the Brinkman box task
Fig. 7
Fig. 7
Schematic representation of the pattern of callosal projection reaching PM in monkeys subjected to a permanent lesion of M1 (black hatched area) and interpretation of the present results. In the left panel, the control (untreated) monkeys exhibit a modest, spontaneous regenerative axonal sprouting of the callosal projection reaching the ipsilesional PM (blue axon terminal). In the right panel, in contrast, the anti-Nogo-A antibody treatment promotes local compensatory sprouting of the callosal axons (green axon terminals), in particular in PM where BDA was injected. In other words, the results of the present study are consistent with an enhanced number of callosal neurons in the homotypic PM of the intact hemisphere in the anti-Nogo-A antibody-treated monkeys as compared to the control (untreated) monkeys. The horizontal dashed red line represents the corpus callosum, with the intact hemisphere above and the lesioned hemisphere below. Neurons in the intact hemisphere send callosal projections to the lesioned hemisphere, terminating with axonal boutons (small filled circles). The red circles represent Nogo-A, inhibiting axonal growth in the adult central nervous system. In the right panel (treated monkeys), Nogo-A is neutralized with an anti-Nogo-A antibody. The brown syringe represents the injection of the tracer BDA in the ipsilesional PM, whereas the brown arrows are for the retrograde axonal transport of BDA from the injected PM to the intact hemisphere. As a result, some neurons are retrogradely labelled with BDA (brown soma in the intact hemisphere). The area “SMA” comprises both pre-SMA and SMA-proper, whereas the area “CMA” includes the three subdivisions of CMA

Similar articles

Cited by

References

    1. Akkal D, Dum RP, Strick PL. Supplementary motor area and presupplementary motor area: targets of basal ganglia and cerebellar output. J Neurosci. 2007;27:10659–10673. doi: 10.1523/JNEUROSCI.3134-07.2007. - DOI - PMC - PubMed
    1. Bashir S, Kaeser M, Wyss A, Hamadjida A, Liu Y, Bloch J, Brunet JF, Belhaj-Saif A, Rouiller EM. Short-term effects of unilateral lesion of the primary motor cortex (M1) on ipsilesional hand dexterity in adult macaque monkeys. Brain Struct Funct. 2012;217:63–79. doi: 10.1007/s00429-011-0327-8. - DOI - PMC - PubMed
    1. Beaud ML, Schmidlin E, Wannier T, Freund P, Bloch J, Mir A, Schwab ME, Rouiller EM. Anti-Nogo-A antibody treatment does not prevent cell body shrinkage in the motor cortex in adult monkeys subjected to unilateral cervical cord lesion. BMC Neurosci. 2008;9:5. doi: 10.1186/1471-2202-9-5. - DOI - PMC - PubMed
    1. Benes FM, Lange N. Two-dimensional versus three-dimensional cell counting: a practical perspective. Trends Neurosci. 2001;24:11–17. doi: 10.1016/S0166-2236(00)01660-X. - DOI - PubMed
    1. Boussaoud D, Tanné-Gariépy J, Wannier T, Rouiller EM. Callosal connections of dorsal versus ventral premotor areas in the macaque monkey: a multiple retrograde tracing study. BMC Neurosci. 2005;6:67. doi: 10.1186/1471-2202-6-67. - DOI - PMC - PubMed

Publication types

MeSH terms