Comparative Study
. 2012 Dec;46(12):1145-58.
doi: 10.1177/0004867412457224. Epub 2012 Sep 18.

Differential putaminal morphology in Huntington's disease, frontotemporal dementia and Alzheimer's disease

Affiliations
Comparative Study

Differential putaminal morphology in Huntington's disease, frontotemporal dementia and Alzheimer's disease

Jeffrey C L Looi et al. Aust N Z J Psychiatry. 2012 Dec.

Abstract

Objective: Direct neuronal loss or deafferentation of the putamen, a critical hub in corticostriatal circuits, may result in diverse and distinct cognitive and motoric dysfunction in neurodegenerative disease. Differential putaminal morphology, as a quantitative measure of corticostriatal integrity, may thus be evident in Huntington's disease (HD), Alzheimer's disease (AD) and frontotemporal dementia (FTD), diseases with differential clinical dysfunction.

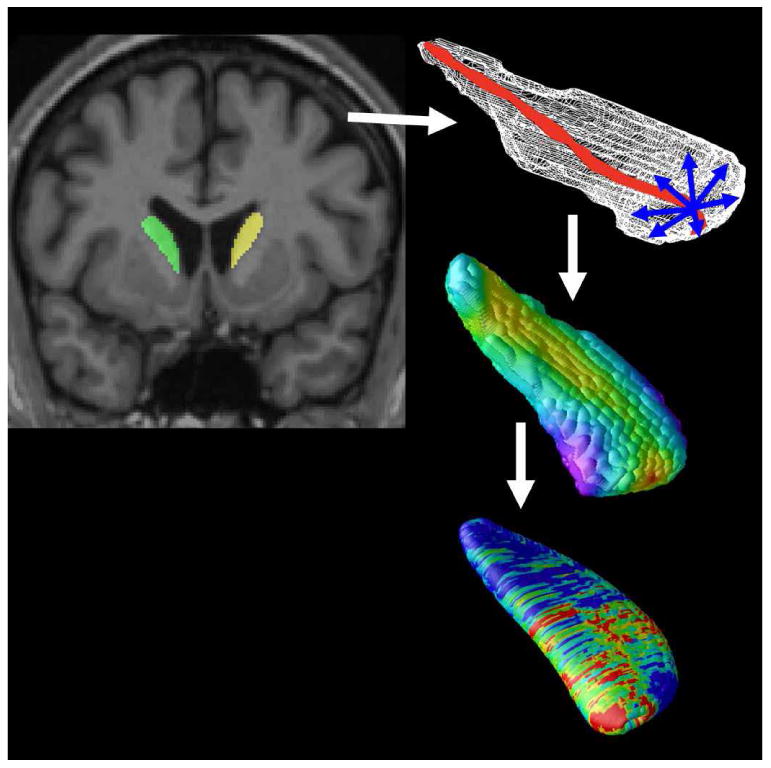
Methods: HD (n = 17), FTD (n = 33) and AD (n = 13) patients were diagnosed according to international consensus criteria and, with healthy controls (n = 17), were scanned on the same MRI scanner. Patients underwent brief cognitive testing using the Neuropsychiatry Unit Cognitive Assessment Tool (NUCOG). Ten MRI scans from this dataset were manually segmented as a training set for the Adaboost algorithm, which automatically segmented all remaining scans for the putamen, yielding the following subset of the data: 9 left and 12 right putamen segmentations for AD; 25 left and 26 right putamina for FTD; 16 left and 15 right putamina for HD; 12 left and 12 right putamina for controls. Shape analysis was performed at each point on the surface of each structure using a multiple regression controlling for age and sex to compare radial distance across diagnostic groups.

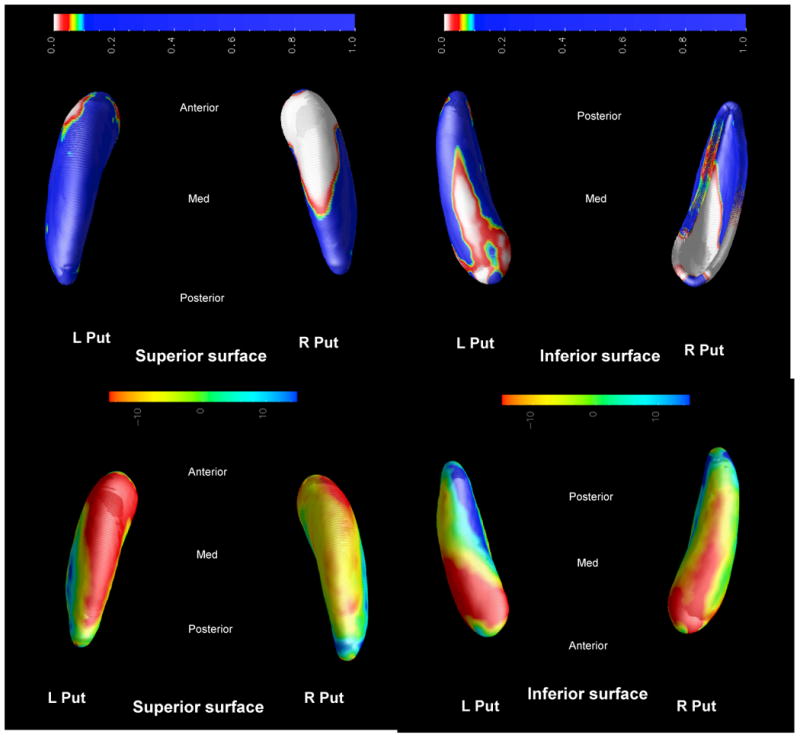
Results: Age, but not sex and intracranial volume (ICV), were significantly different in the segmentation subgroups by diagnosis. The AD group showed significantly poorer performance on cognitive testing than FTD. Mean putaminal volumes were HD < FTD < AD ≤ controls, controlling for age and ICV. The greatest putaminal shape deflation was evident in HD, followed by FTD, in regions corresponding to the interconnections to motoric cortex.

Conclusions: Differential patterns of putaminal atrophy in HD, FTD and AD, with relevance to corticostriatal circuits, suggest the putamen may be a suitable clinical biomarker in neurodegenerative disease.


Figures

Figure 1
Figure 1. Mapping Atrophy
After image preprocessing, our Adaboost algorithm automatically segments the caudate nucleus and putamen bilaterally. A central curve (top right) was calculated through the longitudinal axis of each structure and the radial distance to each point in a 3D surface mesh was used as a highly localized measure of atrophy (middle right). P-values are calculated at each surface point (bottom right) showing the significance of differences in radial distances between diagnostic groups or their associations with clinical scores. These maps visualized the profile of local shape differences or their clinical correlates at a point-wise level.
Figure 2
Figure 2. Boxplots of putamen volume
HD: Huntington's disease; FTD: Frontotemporal dementia; AD: Alzheimer's disease; CTL: Healthy controls. Outlier data points are referred to by case number, outliers defined if they extend more than 1.5 lengths from edge of box, extreme points indicated by an asterisk extend more than three box lengths from the edge of the box. Statistical shape maps and plots
Figure 3
Figure 3. HD vs CTL
Top: Group difference P-map Bottom: Percentage difference map
Figure 4
Figure 4. HD vs CTL
Top: Group difference P-map Bottom: Percentage difference map
Figure 5
Figure 5. HD vs FTD
Top: Group difference P-map Bottom: Percentage difference map
Figure 6
Figure 6. FTD vs AD
Top: Group difference P-map Bottom: Percentage difference map The statistical maps are displayed in two formats. Group difference P-maps show the surface of the object such that the color scale represents the P-value at each point on the surface. The Percentage maps display the degree of shape difference between groups as a percentage of the larger group's mean radial size. The color scale shows the percentage difference, with negative values representing atrophy. In the maps displayed, the superior surface refers to the dorsal anatomical aspect, whilst the inferior surface refers to the ventral aspect. The medial aspect of right and left hemisphere models face each other, and the lateral aspect faces the outside of the image. For example, in Figure 3, the images are, clockwise from left: group difference P-map superior (dorsal) aspect of putamen, with the anterior (rostral) aspect towards the top of the image; group difference P-map inferior (ventral) aspect of putamen, with the rostral aspect towards the bottom of the image; percentage difference map ventral aspect of the putamen, with the rostral aspect towards the bottom of the image; percentage difference map dorsal aspect of the putamen, with the rostral aspect towards the top of the image. HD: Huntington's disease; FTD: Frontotemporal dementia; AD: Alzheimer's disease; CTL: Healthy controls R:right L:left Put: putamen Anterior: anterior (rostral) end Posterior: posterior (caudal) end Med: medial aspect

Similar articles

Cited by

References

    1. Alexander GE, Delong MR, Strick PL. Parallel organisation of functionally segregated circuits linking basal ganglia and cortex. Ann Rev Neurosci. 1986;9:357–381. - PubMed
    1. Apostolova LG, Mosconi L, Thompson PM, Green AE, Hwang KS, Ramirez A, Mistur R, Tsui WH, de Leon MJ. Subregional hippocampal atrophy predicts Alzheimer's dementia in the cognitively normal. Neurobiology of Aging. 2010;31:1077–1088. - PMC - PubMed
    1. Aylward E, Sparks BF, Field KM, Yallapragada V, Shpritz BD, Rosenblatt A, Brandt J, Gourley LM, Liang K, Zhou H, Margolis RL, Ross CA. Onset and rate of striatal atrophy in preclinical Huntington disease. Neurology. 2004;63:66–72. - PubMed
    1. Bansal R, Staib LH, Xu D, Zhu H, Peterson BS. Statistical analyses of brain surfaces using Gaussian random fields on 2-D manifolds. IEEE Trans Med Imaging. 2007;26:46–57. - PMC - PubMed
    1. Bolam JP, Hanley JJ, Booth PAC, Bevan MD. Synaptic organisation of the basal ganglia. Journal of Anatomy. 2000;196:527–542. - PMC - PubMed

Publication types

MeSH terms