

doi: 10.1038/ni.2404.
Maintaining system homeostasis: the third law of Newtonian immunology
Affiliations
- PMID: 22990887
- PMCID: PMC3518435
- DOI: 10.1038/ni.2404
Item in Clipboard
Maintaining system homeostasis: the third law of Newtonian immunology
Nat Immunol.
2012 Oct.
Abstract
Because of the potent effector mechanisms of the immune system, the potential for self-destructive immune responses is especially high and many negative regulatory modalities exist to prevent excessive tissue damage. This Commentary places such regulatory mechanisms in the larger context of system organization on many scales. The sometimes counterintuitive nature of feedback control is discussed and a case is made for greater attention to quantitative spatiotemporal aspects of regulation, rather than limiting the discussion to the qualitative descriptions of pathways that dominate at present.
Figures
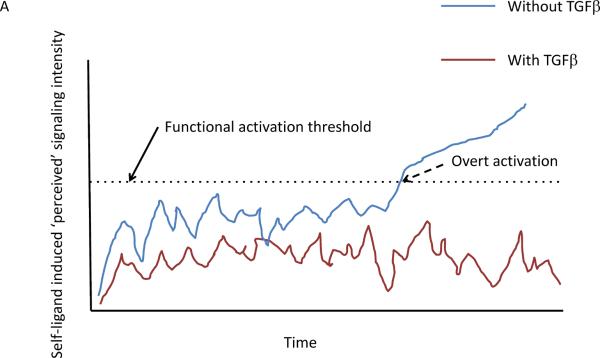
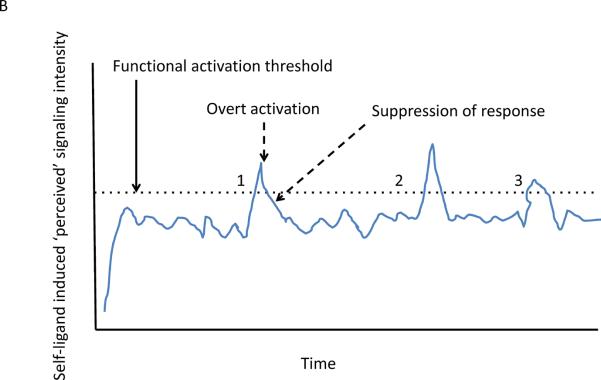
Graphical depiction of the effect of tonic suppression on lymphocyte activation in response to self-ligand induced signaling input. (a) The blue line shows the behavior of a cell over time in the absence of TFG-β suppression, with occasional traverse (dashed arrow) over the functional activation threshold (dotted line). In contrast, the same T cell in the presence of TFG-β never crosses the activation threshold into a truly activated state. In this scenario, TFG-β prevents cells from responding to self stimuli. (b) The blue line shows the behavior of a cell over time, with occasional traverse (dashed arrow) over the functional activation threshold (dotted line). Here, Tregs act in response to the initial activation to suppress the activated proto-effector back into the resting state after this initial activation response and this occurs repeatedly at times 1, 2, and 3. The potential for escape from control at any of these times is greater than in a, where TFG-β prevents supra-activation responses in the first place.
Graphical depiction of the effect of tonic suppression on lymphocyte activation in response to self-ligand induced signaling input. (a) The blue line shows the behavior of a cell over time in the absence of TFG-β suppression, with occasional traverse (dashed arrow) over the functional activation threshold (dotted line). In contrast, the same T cell in the presence of TFG-β never crosses the activation threshold into a truly activated state. In this scenario, TFG-β prevents cells from responding to self stimuli. (b) The blue line shows the behavior of a cell over time, with occasional traverse (dashed arrow) over the functional activation threshold (dotted line). Here, Tregs act in response to the initial activation to suppress the activated proto-effector back into the resting state after this initial activation response and this occurs repeatedly at times 1, 2, and 3. The potential for escape from control at any of these times is greater than in a, where TFG-β prevents supra-activation responses in the first place.
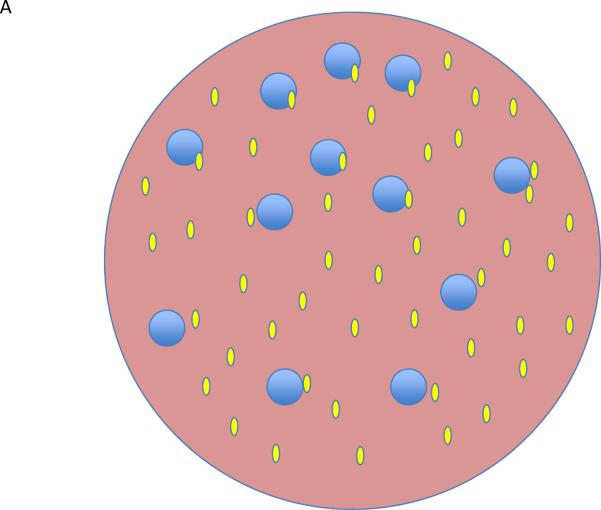
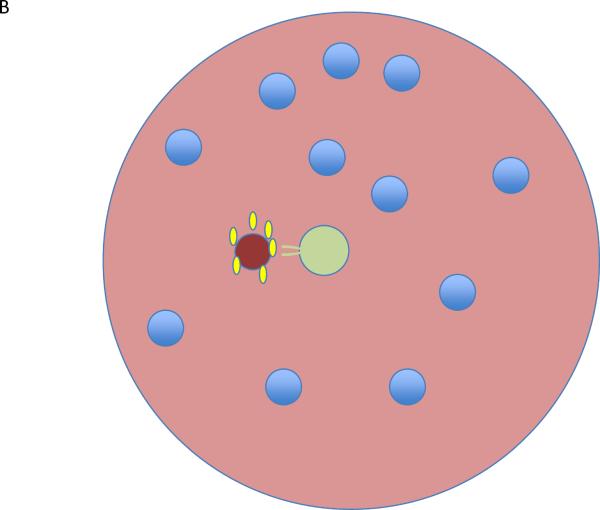
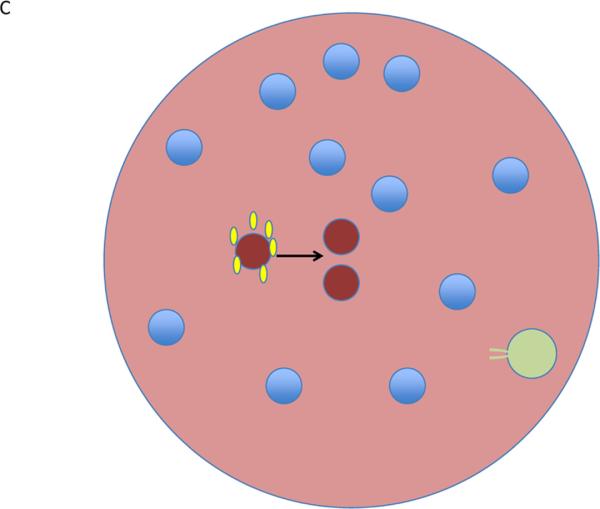
Lymphocyte activation in tissues. (a) In a tissue, all regions are suffused with TFG-β (green) and all lymphocytes (blue) are subject to suppressive control. (b) A single proto-effector becomes activated (red) and produces IL-2 (yellow). If a Treg (pale green) is nearby, it can bind and remove the IL-2 from the region, becoming activated in the process and further mediating suppressive effects that limit the proto—effector response. (c) If a Treg is not positioned near the proto-effector, then activation and clonal expansion could continue. This contrasts with the volume-encompassing suppressive effect of tissue TGF-β described in a.
Lymphocyte activation in tissues. (a) In a tissue, all regions are suffused with TFG-β (green) and all lymphocytes (blue) are subject to suppressive control. (b) A single proto-effector becomes activated (red) and produces IL-2 (yellow). If a Treg (pale green) is nearby, it can bind and remove the IL-2 from the region, becoming activated in the process and further mediating suppressive effects that limit the proto—effector response. (c) If a Treg is not positioned near the proto-effector, then activation and clonal expansion could continue. This contrasts with the volume-encompassing suppressive effect of tissue TGF-β described in a.
Lymphocyte activation in tissues. (a) In a tissue, all regions are suffused with TFG-β (green) and all lymphocytes (blue) are subject to suppressive control. (b) A single proto-effector becomes activated (red) and produces IL-2 (yellow). If a Treg (pale green) is nearby, it can bind and remove the IL-2 from the region, becoming activated in the process and further mediating suppressive effects that limit the proto—effector response. (c) If a Treg is not positioned near the proto-effector, then activation and clonal expansion could continue. This contrasts with the volume-encompassing suppressive effect of tissue TGF-β described in a.
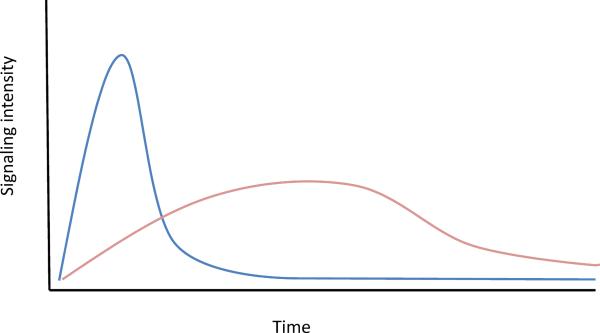
In many signaling systems, a strong stimulus results is strong and rapid induction of negative feedback pathways that quickly suppress the signaling response (blue). The result is a spiked response, with a high peak but short duration. This contrasts with a weaker stimulus that reaches a lower peak of signaling but where the response is sustained because of a slower and less robust induction of the negative feedback pathway (pink). Because of the way immediate early and early gene transcription programs are kinetically linked to signaling inputs, these two different outcomes of stimulation of the cell can lead to markedly different downstream effects.
References
-
- Sissons JG, Oldstone MB. Killing of virus-infected cells by cytotoxic lymphocytes. The Journal of infectious diseases. 1980;142:114–119. - PubMed
-
- Harty JT, Tvinnereim AR, White DW. CD8+ T cell effector mechanisms in resistance to infection. Annual review of immunology. 2000;18:275–308. - PubMed
-
- Cullen SP, Martin SJ. Mechanisms of granule-dependent killing. Cell death and differentiation. 2008;15:251–262. - PubMed
-
- Bogdan C, Rollinghoff M, Diefenbach A. Reactive oxygen and reactive nitrogen intermediates in innate and specific immunity. Current opinion in immunology. 2000;12:64–76. - PubMed
Publication types
MeSH terms
Grants and funding
LinkOut - more resources
Full Text Sources
Medical
