Comparative Study
. 2012 Sep 18;3(5):e00252-12.
doi: 10.1128/mBio.00252-12. Print 2012.

Streamlining and core genome conservation among highly divergent members of the SAR11 clade

Affiliations
Comparative Study

Streamlining and core genome conservation among highly divergent members of the SAR11 clade

Jana Grote et al. mBio. .

Abstract

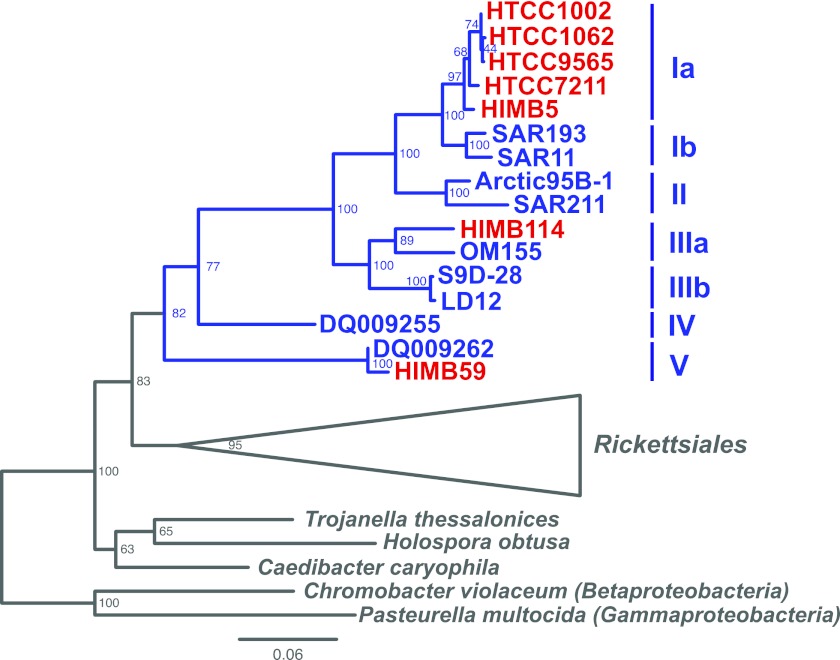
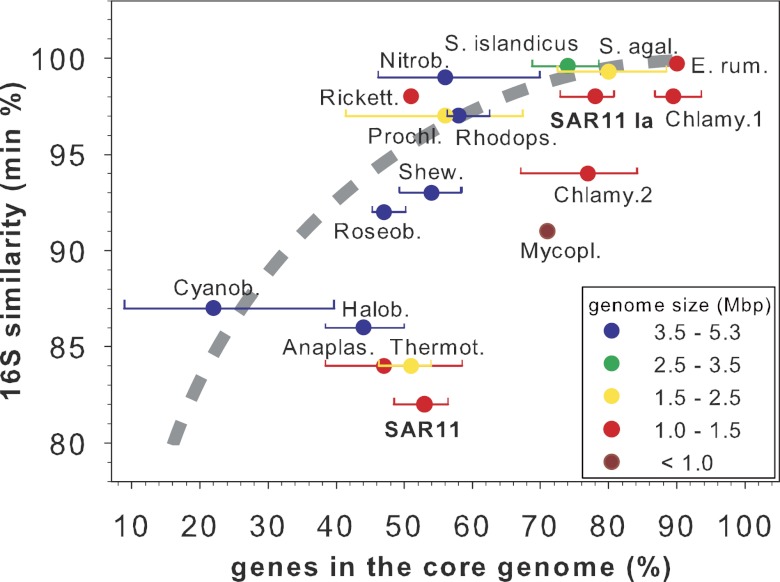
SAR11 is an ancient and diverse clade of heterotrophic bacteria that are abundant throughout the world's oceans, where they play a major role in the ocean carbon cycle. Correlations between the phylogenetic branching order and spatiotemporal patterns in cell distributions from planktonic ocean environments indicate that SAR11 has evolved into perhaps a dozen or more specialized ecotypes that span evolutionary distances equivalent to a bacterial order. We isolated and sequenced genomes from diverse SAR11 cultures that represent three major lineages and encompass the full breadth of the clade. The new data expand observations about genome evolution and gene content that previously had been restricted to the SAR11 Ia subclade, providing a much broader perspective on the clade's origins, evolution, and ecology. We found small genomes throughout the clade and a very high proportion of core genome genes (48 to 56%), indicating that small genome size is probably an ancestral characteristic. In their level of core genome conservation, the members of SAR11 are outliers, the most conserved free-living bacteria known. Shared features of the clade include low GC content, high gene synteny, a large hypervariable region bounded by rRNA genes, and low numbers of paralogs. Variation among the genomes included genes for phosphorus metabolism, glycolysis, and C1 metabolism, suggesting that adaptive specialization in nutrient resource utilization is important to niche partitioning and ecotype divergence within the clade. These data provide support for the conclusion that streamlining selection for efficient cell replication in the planktonic habitat has occurred throughout the evolution and diversification of this clade. IMPORTANCE The SAR11 clade is the most abundant group of marine microorganisms worldwide, making them key players in the global carbon cycle. Growing knowledge about their biochemistry and metabolism is leading to a more mechanistic understanding of organic carbon oxidation and sequestration in the oceans. The discovery of small genomes in SAR11 provided crucial support for the theory that streamlining selection can drive genome reduction in low-nutrient environments. Study of isolates in culture revealed atypical organic nutrient requirements that can be attributed to genome reduction, such as conditional auxotrophy for glycine and its precursors, a requirement for reduced sulfur compounds, and evidence for widespread cycling of C1 compounds in marine environments. However, understanding the genetic variation and distribution of such pathways and characteristics like streamlining throughout the group has required the isolation and genome sequencing of diverse SAR11 representatives, an analysis of which we provide here.


Figures

FIG 1
FIG 1
16S phylogenetic tree of the SAR11 clade (blue), showing a subset of major subclades defined here and elsewhere (6, 7) and the genomes included in this study (red). Bootstrap support is displayed at the nodes. Scale bar indicates 0.06 changes per position.
FIG 2
FIG 2
(A) Venn diagram showing the number of OCs shared between the SAR11 subclade Ia core genome, HIMB114, and HIMB59. (B) The relative contribution of core (blue), shared non-core (orange), and unique (red) orthologs to the pan-genome at each level of divergence. The total size of each bar is proportional to the total number of orthologs in the pan-genome. The scale bar indicates 0.2 changes per position. The tree was redrawn based on the work of Thrash et al. (6). (C) Venn diagram showing the number of shared OCs among the five strains of SAR11 subclade Ia.
FIG 3
FIG 3
SAR11 pan-genome analysis. The number of core genes (A), new orthologs (B), or total genes (pan-genome) (C) is plotted versus the sequential addition of genomes 7!(N!(7 − N)!). Squares show average values for all members of SAR11 (red) and SAR11 subclade Ia (blue). In panel A, the curve represents the least-squares fit of the average values to an exponential decay function, and the dotted line indicates the asymptotic values predicted for the SAR11 and SAR11 subclade Ia core genome size. Curves in panels B and C are from power law regression analyses.
FIG 4
FIG 4
Comparison of the minimal 16S rRNA gene similarity, core genome conservation, and average genome size for relevant groups of the Bacteria and Archaea. Averages (circles) within the range (lines) of genes in the core genome as percentages of total genes or total protein coding genes as specified in the original publication are shown. Circles without lines had insufficient information to calculate a range. 16S rRNA gene similarities were calculated with the megablast using default settings. The color code indicates average genome sizes. The dotted curve represents approximate average values taken from Fig. 1a in reference 25. The number of genomes compared per study and the average number of core genes can be found at http://giovannonilab.science.oregonstate.edu/publications. Anaplas., Anaplasmataceae (31); Chlamy., Chlamydiaceae; Chlamy.1, Chlamydophila psittaci, Chlamydia abortus, Chlamydia caviae, and Chlamydophila felis; Chlamy.2, C. psittaci, C. abortus, Chlamydophila pneumoniae, and Chlamydia trachomatis (35); Cyanob., cyanobacteria (28); E. rum., Ehrlichia ruminantium (36); Halob., Halobacteriaceae (29); Mycopl., Mycoplasma (89); Nitrob., Nitrobacter (90); Prochl., Prochlorococcus (32); Rhodops., Rhodopseudomonas (33); Rickett., Rickettsia (34); Roseob., Roseobacter clade (47); Shew., Shewanella (27); S. agal., Streptococcus agalactiae (23); S. islandicus, Sulfolobus islandicus (37); Thermot., Thermotogales (30).
FIG 5
FIG 5
(A) 16S rRNA gene identity versus average amino acid identity (AAI). AAI for each pairwise comparison is plotted for all shared genes. Error bars are standard errors; “n” is the number of pairwise comparisons in a group of points. Shaded regions are an approximation of data from the work of Konstantinidis and Tiedje, 2007 (25), delineating proposed (left to right) genus and species boundaries based on AAI versus 16S rRNA identity. (B) Gene order conservation versus average normalized bit score of protein-coding genes. The data are from Fig. 2 of the work of Yelton et al. (38), with our new analyses of the SAR11 genomes overlaid in red. Gene order conservation is defined as the fraction of genes shared by any two organisms that are syntenic (39); “n” is the same as in panel A.
FIG 6
FIG 6
Circular representation of SAR11 genomes. The genomes are arranged in order from the outermost to the innermost as follows: HTCC1062, HTCC1002, HTCC9565, HTCC7211, HIMB5, HIMB114, and HIMB59. Organisms are aligned with 0 at dnaA, sequences going clockwise to dnaN and continuing in the order in which they are presented at IMG. Blue, core SAR11 genes; bright green, additional SAR11 subclade Ia core genes; orange, shared non-core genes, red, unique genes; black, rRNA genes. The outer scale is measured in units of 10-kbp increments. HVR2 is highlighted in black. Gaps in complete genomes were necessary to display the genomes in this manner due to the disparity of genome sizes.
FIG 7
FIG 7
Paralogs in SAR11. (A) The distribution of paralogs as a function of total protein-coding genes. Blue, core genes; green, additional SAR11 subclade 1a core genes; orange, shared non-core genes; red, unique genes; grey, single-copy genes. (B) Distribution of paralogs by strain according to COG category.
FIG 8
FIG 8
Relative abundance and distribution of selected COG categories within SAR11 core and flexible genomes (A) or SAR11 shared non-core and unique genes (B).

References

    1. Morris RM, et al. 2002. SAR11 clade dominates ocean surface bacterioplankton communities. Nature 420:806–810 - PubMed
    1. Schattenhofer M, et al. 2009. Latitudinal distribution of prokaryotic picoplankton populations in the Atlantic Ocean. Environ. Microbiol. 11:2078–2093 - PubMed
    1. Rocap G, et al. 2003. Genome divergence in two Prochlorococcus ecotypes reflects oceanic niche differentiation. Nature 424:1042–1047 - PubMed
    1. Rappé MS, Connon SA, Vergin KL, Giovannoni SJ. 2002. Cultivation of the ubiquitous SAR11 marine bacterioplankton clade. Nature 418:630–633 - PubMed
    1. Giovannoni SJ, et al. 2005. Genome streamlining in a cosmopolitan oceanic bacterium. Science 309:1242–1245 - PubMed

Publication types

LinkOut - more resources