

Rate and molecular spectrum of spontaneous mutations in the bacterium Escherichia coli as determined by whole-genome sequencing
- PMID: 22991466
- PMCID: PMC3478608
- DOI: 10.1073/pnas.1210309109
Rate and molecular spectrum of spontaneous mutations in the bacterium Escherichia coli as determined by whole-genome sequencing
Abstract
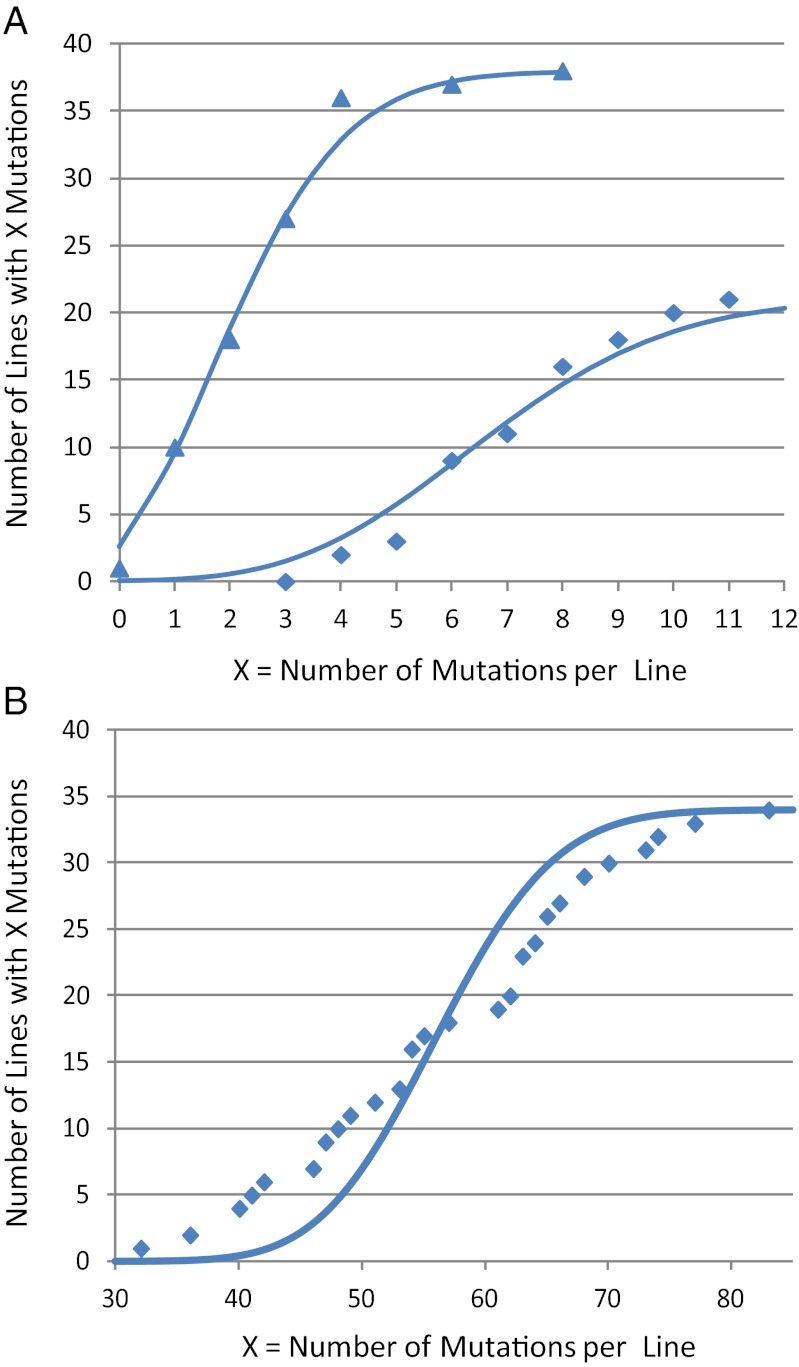
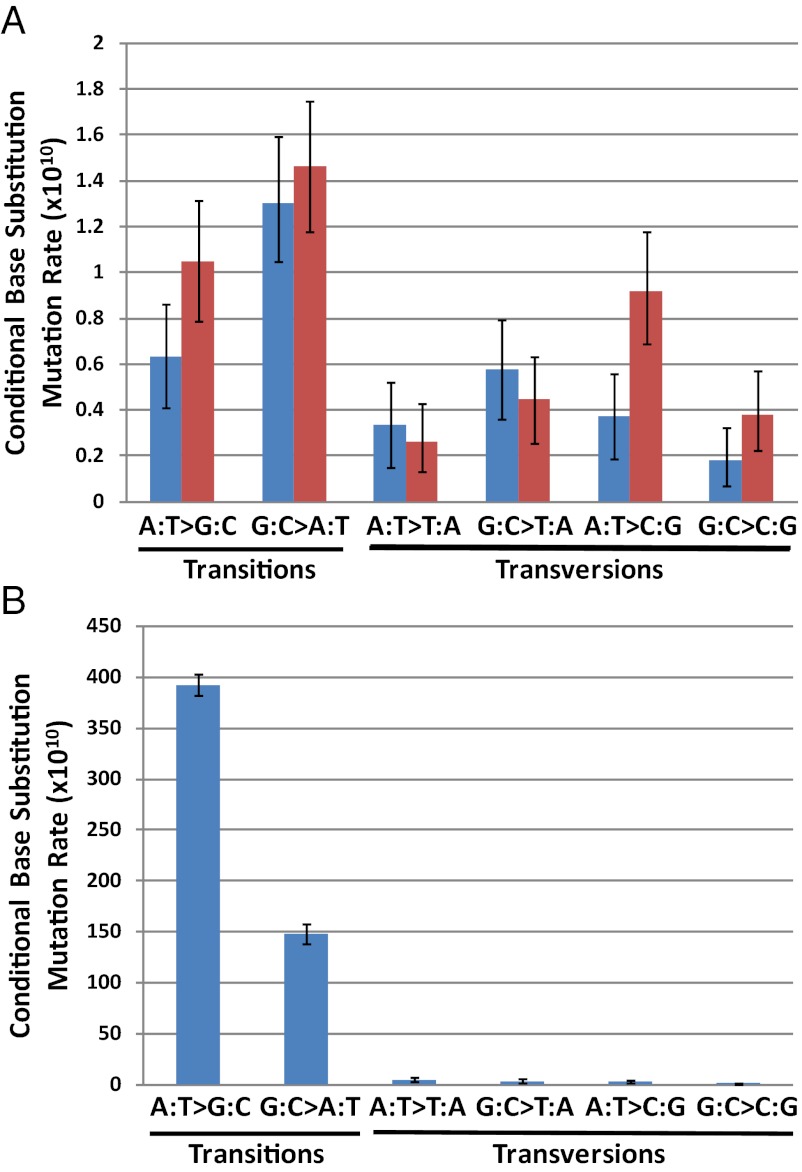
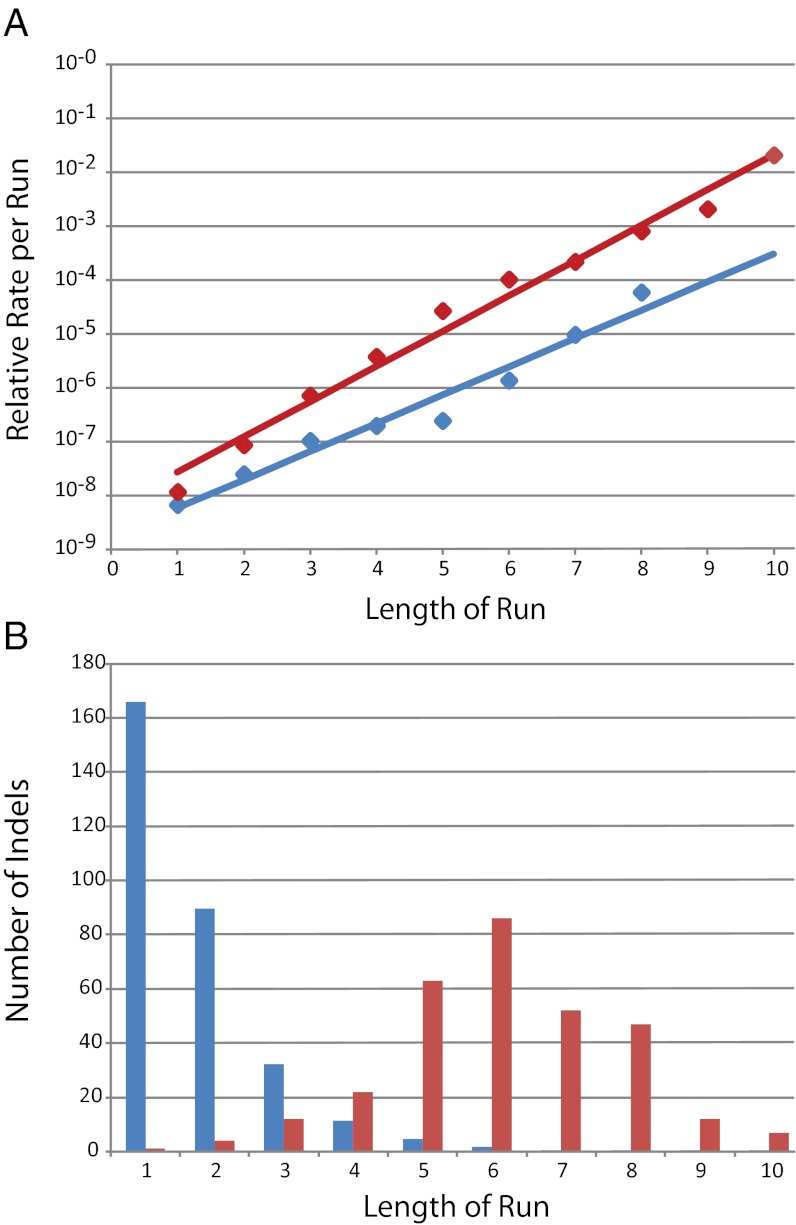
Knowledge of the rate and nature of spontaneous mutation is fundamental to understanding evolutionary and molecular processes. In this report, we analyze spontaneous mutations accumulated over thousands of generations by wild-type Escherichia coli and a derivative defective in mismatch repair (MMR), the primary pathway for correcting replication errors. The major conclusions are (i) the mutation rate of a wild-type E. coli strain is ~1 × 10(-3) per genome per generation; (ii) mutations in the wild-type strain have the expected mutational bias for G:C > A:T mutations, but the bias changes to A:T > G:C mutations in the absence of MMR; (iii) during replication, A:T > G:C transitions preferentially occur with A templating the lagging strand and T templating the leading strand, whereas G:C > A:T transitions preferentially occur with C templating the lagging strand and G templating the leading strand; (iv) there is a strong bias for transition mutations to occur at 5'ApC3'/3'TpG5' sites (where bases 5'A and 3'T are mutated) and, to a lesser extent, at 5'GpC3'/3'CpG5' sites (where bases 5'G and 3'C are mutated); (v) although the rate of small (≤4 nt) insertions and deletions is high at repeat sequences, these events occur at only 1/10th the genomic rate of base-pair substitutions. MMR activity is genetically regulated, and bacteria isolated from nature often lack MMR capacity, suggesting that modulation of MMR can be adaptive. Thus, comparing results from the wild-type and MMR-defective strains may lead to a deeper understanding of factors that determine mutation rates and spectra, how these factors may differ among organisms, and how they may be shaped by environmental conditions.
Conflict of interest statement
The authors declare no conflict of interest.
Figures
References
-
- Ochman H. Neutral mutations and neutral substitutions in bacterial genomes. Mol Biol Evol. 2003;20:2091–2096. - PubMed
-
- Wielgoss S, et al. 2011. Mutation rate inferred from synonymous substitutions in a long-term evolution experiment with Escherichia coli. G3 (Bethesda) 1:183–186.
-
- Drake JW. 2012. Contrasting mutation rates from specific-locus and long-term mutation-accumulation procedures. G3 (Bethesda) 2:483–485.
-
- Keightley PD, Halligan DL. Analysis and implications of mutational variation. Genetica. 2009;136:359–369. - PubMed
Publication types
MeSH terms
Substances
LinkOut - more resources
Full Text Sources
Other Literature Sources
Research Materials
