. 2012 Oct 16;109(42):E2885-94.
doi: 10.1073/pnas.1202128109. Epub 2012 Sep 18.

Statistical connectivity provides a sufficient foundation for specific functional connectivity in neocortical neural microcircuits

Affiliations

Statistical connectivity provides a sufficient foundation for specific functional connectivity in neocortical neural microcircuits

Sean L Hill et al. Proc Natl Acad Sci U S A. .

Abstract

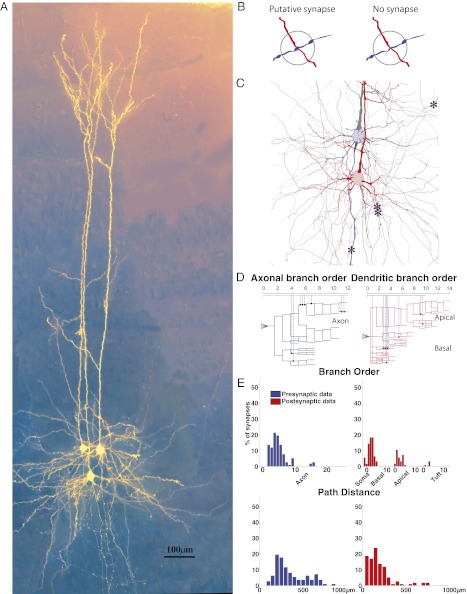
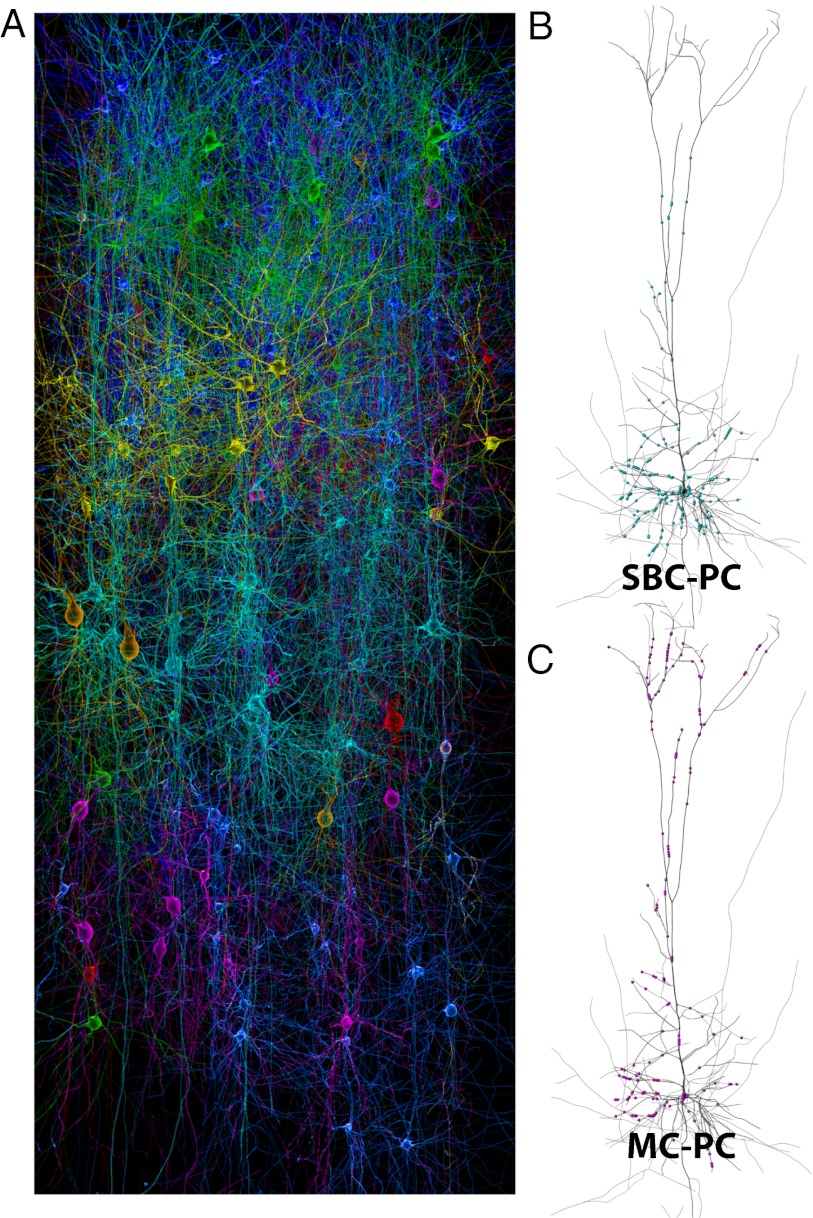
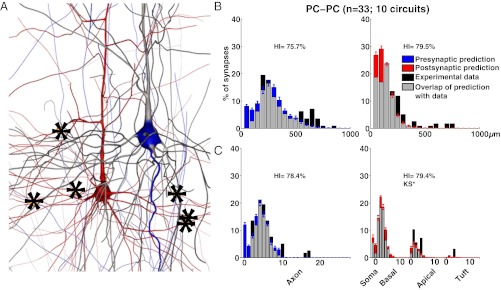
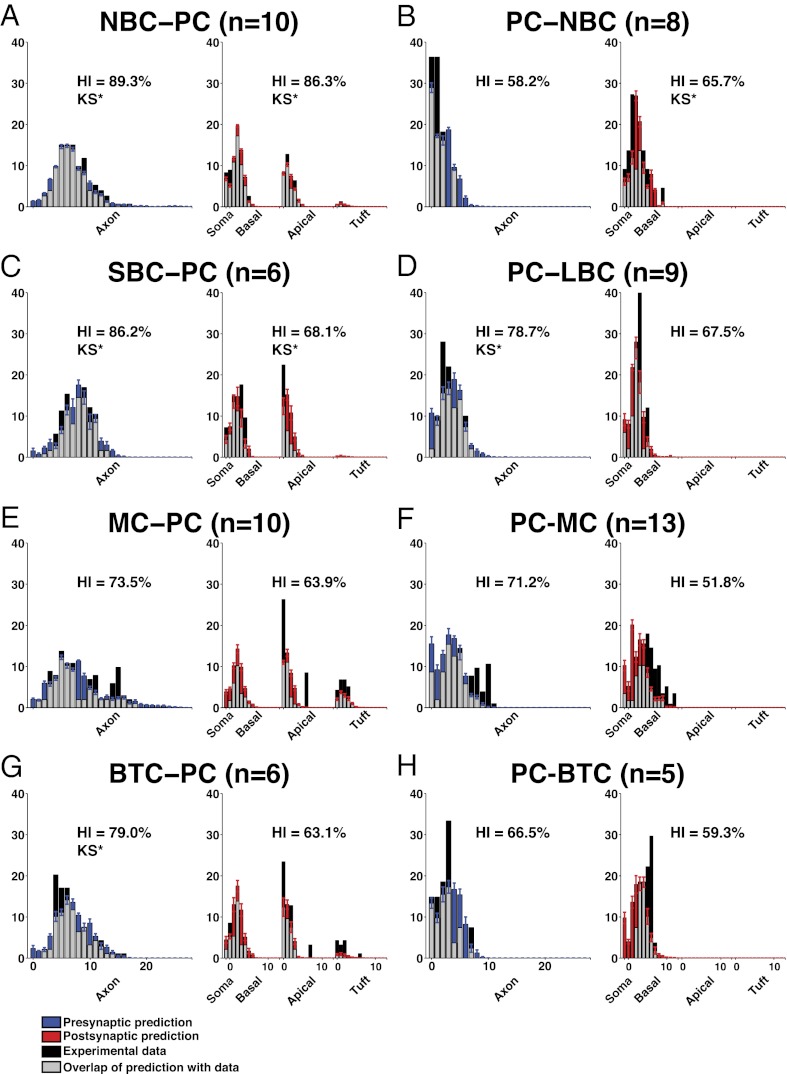
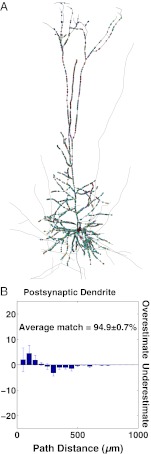
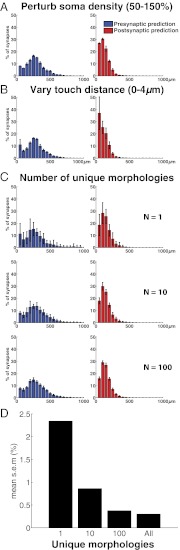
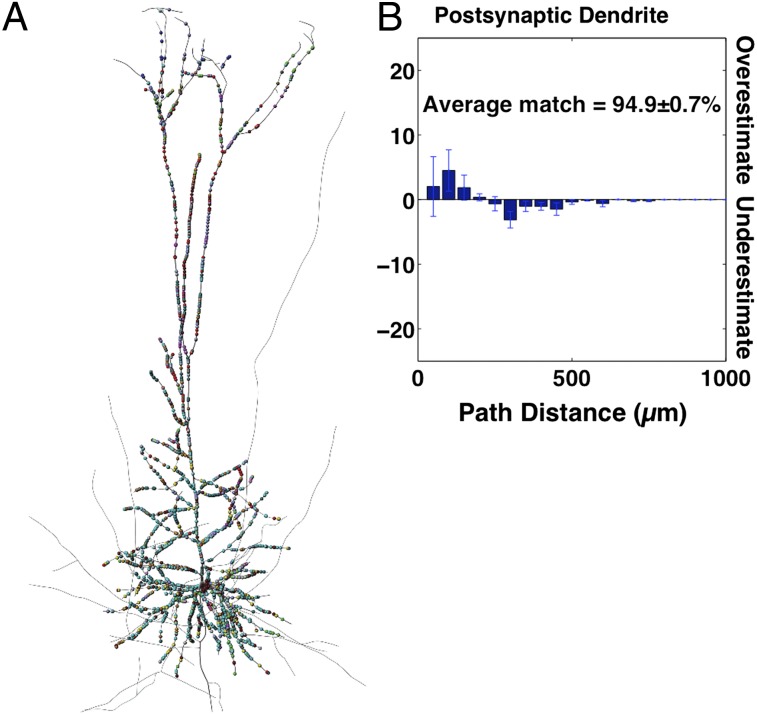
It is well-established that synapse formation involves highly selective chemospecific mechanisms, but how neuron arbors are positioned before synapse formation remains unclear. Using 3D reconstructions of 298 neocortical cells of different types (including nest basket, small basket, large basket, bitufted, pyramidal, and Martinotti cells), we constructed a structural model of a cortical microcircuit, in which cells of different types were independently and randomly placed. We compared the positions of physical appositions resulting from the incidental overlap of axonal and dendritic arbors in the model (statistical structural connectivity) with the positions of putative functional synapses (functional synaptic connectivity) in 90 synaptic connections reconstructed from cortical slice preparations. Overall, we found that statistical connectivity predicted an average of 74 ± 2.7% (mean ± SEM) synapse location distributions for nine types of cortical connections. This finding suggests that chemospecific attractive and repulsive mechanisms generally do not result in pairwise-specific connectivity. In some cases, however, the predicted distributions do not match precisely, indicating that chemospecific steering and aligning of the arbors may occur for some types of connections. This finding suggests that random alignment of axonal and dendritic arbors provides a sufficient foundation for specific functional connectivity to emerge in local neural microcircuits.


Conflict of interest statement

The authors declare no conflict of interest.

Figures

Fig. 1.
Fig. 1.
Patterning of putative synapses between synaptically coupled neurons. (A) Synaptically coupled L5 PCs stained and in false color. (B) Schematic of the criteria for determining whether an apposition is a putative synapse (Left) or not (Right) (Materials and Methods). (C) A reconstruction of two synaptically coupled neurons (asterisks indicate locations of putative synapses). (D) An axogram (Left) and dendrogram (Right) indicating how synaptic locations are recorded. (E) Histograms of locations of putative synapses on the axon (Left, blue) and dendrites (Right, red), where the x axis is the axonal or dendritic branch order where (Upper) the putative synapse was observed (x axis) or (Lower) the path distance to the putative synapse along the axon or dendrite from the soma.
Fig. 2.
Fig. 2.
Cell type-specific domain specificity from statistical connectivity. (A) A model neocortical microcircuit illustrating some of the different pyramidal and interneuron morphologies used and arranged in five layers. Each morphological type is colored differently. (B) Incidental appositions (blue dots) formed by a population of SBCs on a single representative PC. (C) Incidental appositions (purple dots) formed by a population of MCs on the same PC as in B.
Fig. 3.
Fig. 3.
Comparing experimental and predicted connectivity patterns between L5 PCs. Experimental and predicted innervation patterns were both obtained for all neurons within 50 μm of each other in the microcircuit. The axonal predicted innervation patterns are indicated in blue, the dendritic predicted innervation patterns are indicated in red, experimentally measured innervation patterns are indicated in black, and the overlap is indicated in gray. (A) A pair of coupled PCs from the model microcircuit. (B) Overlap according to path distance. (C) Overlap according to branch order. Error bars in B and C indicate SEM across 10 circuits constructed with different subsets of neurons.
Fig. 4.
Fig. 4.
Comparison of experimental and predicted innervation patterns for different types of connection. The color code is the same as in Fig.3. Innervation patterns (mean ± SEM; over apposition distances = 0–4 μm) according to branch order. (A) Experimental and predicted innervation patterns for NBC to PC. (B) PC to NBC. (C) SBC to PC. (D) PC to LBC. (E) MC to PC. (F) PC to MC. (G) BTC to PC. (H) PC to BTC. KS* indicates significant Kolmogorov-Smirnov equality (α < 0.05).
Fig. 5.
Fig. 5.
Complementary coverage of a neuron with appositions from multiple types of presynaptic neuron. (A) A single TTL5 neuron from the model microcircuit and the appositions (colored dots) for nine types of presynaptic neuron, each color coded differently. (B) The mean ± SEM percentage of synapses that were over- or underestimated at different path distances from the soma along the postsynaptic dendrite.
Fig. 6.
Fig. 6.
Morphological diversity confers invariance to structural connectivity. The structural innervation pattern for different circuits built from 24 unique TTL5 PC morphologies (TTL5–TTL5; mean ± SEM; n = 10 circuits). Structural innervation patterns according to path distance from somata. (Left) Axon (blue). (Right) Dendrite (red). (A) Structural innervation patterns (mean ± SEM) for control circuits with different densities of neurons. (B) Structural innervation pattern (mean ± SEM) over varying touch distances (0–4 μm). Note that SEM is higher around somata. (C) Structural innervation pattern (mean ± SEM) for a model microcircuit with an increasing number of unique TTL5 morphologies used to construct each circuit (n = 1, 10, and 100). (D) Bar plot of the mean SE for the model microcircuits in C. Note the decrease in variability of the innervation pattern with an increase in unique morphologies.
Fig. P1.
Fig. P1.
Prediction of synapse positions on a layer 5 pyramidal neuron from other neuron classes. (A) A single pyramidal neuron from the model microcircuit and the predicted synapse locations (colored dots) for nine types of presynaptic neurons that are each a different color. (B) The percentage of synapses (mean ± SEM) that were over- or underestimated at different distances along the postsynaptic dendrite.

References

    1. Ragsdale CW, Grove EA. Patterning the mammalian cerebral cortex. Curr Opin Neurobiol. 2001;11:50–58. - PubMed
    1. Rubenstein JL, Rakic P. Genetic control of cortical development. Cereb Cortex. 1999;9:521–523. - PubMed
    1. Benson DL, Colman DR, Huntley GW. Molecules, maps and synapse specificity. Nat Rev Neurosci. 2001;2:899–909. - PubMed
    1. Polleux F. Genetic mechanisms specifying cortical connectivity: Let’s make some projections together. Neuron. 2005;46:395–400. - PubMed
    1. Cline HT. Dendritic arbor development and synaptogenesis. Curr Opin Neurobiol. 2001;11:118–126. - PubMed

Publication types