

Why has the Universal Coverage Scheme in Thailand achieved a pro-poor public subsidy for health care?
- PMID: 22992431
- PMCID: PMC3382631
- DOI: 10.1186/1471-2458-12-S1-S6
Why has the Universal Coverage Scheme in Thailand achieved a pro-poor public subsidy for health care?
Abstract
Background: Thailand has achieved universal health coverage since 2002 through the implementation of the Universal Coverage Scheme (UCS) for 47 million of the population who were neither private sector employees nor government employees. A well performing UCS should achieve health equity goals in terms of health service use and distribution of government subsidy on health. With these goals in mind, this paper assesses the magnitude and trend of government health budget benefiting the poor as compared to the rich UCS members.
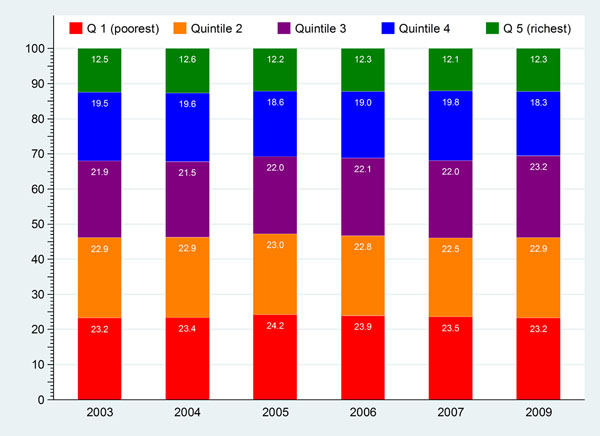
Method: Benefit incidence analysis was conducted using the nationally representative household surveys, Health and Welfare Surveys, between 2003 and 2009. UCS members are grouped into five different socio-economic status using asset indexes and wealth quintiles.
Findings: The total government subsidy, net of direct household payment, for combined outpatient (OP) and inpatient (IP) services to public hospitals and health facilities provided to UCS members, had increased from 30 billion Baht (US$ 1 billion) in 2003 to 40-46 billion Baht in 2004-2009. In 2003 for 23% and 12% of the UCS members who belonged to the poorest and richest quintiles of the whole-country populations respectively, the share of public subsidies for OP service was 28% and 7% for the poorest and the richest quintiles, whereby for IP services the share was 27% and 6% for the poorest and richest quintiles respectively. This reflects a pro-poor outcome of public subsidies to healthcare. The OP and IP public subsidies remained consistently pro-poor in subsequent years.The pro-poor benefit incidence is determined by higher utilization by the poorest than the richest quintiles, especially at health centres and district hospitals. Thus the probability and the amount of household direct health payment for public facilities by the poorest UCS members were less than their richest counterparts.
Conclusions: Higher utilization and better financial risk protection benefiting the poor UCS members are the results of extensive geographical coverage of health service infrastructure especially at district level, adequate finance and functioning primary healthcare, comprehensive benefit package and zero copayment at points of services.
Figures


References
-
- Prakongsai P, Limwattananon S, Tangcharoensathien V. In: Innovations in health system finance in developing and transitional economies. Dov Chernichovsky, Hanson K, editor. London; Emerald Group Publishing Limited; 2009. The Equity impact of the universal coverage policy: lessons from Thailand; pp. 57–81. - PubMed
-
- Ministry of Public Health Department of Health Service Support. 2010.
-
- National Health Security Office. Reports on outpatient visits and hospital admissions. 2011.
-
- Tangcharoensathien V, Limwattananon S, Prakongsai P. Report of the Consortium for Research on Equitable Health Systems (CREHS) Nonthaburi; International Health Policy Program; 2011. The equity impact of Universal Coverage: health care finance, catastrophic health expenditure, utilization and government subsidies in Thailand.
-
- Limwattananon S, Tangcharoensathien V, Prakongsai P, Effects of universal health care coverage introduction on health care access and payments in Thailand. Oral presentation at 8th World Congress on Health Economics, Toronto, Canada, 10-13 July 2011.
Publication types
MeSH terms
LinkOut - more resources
Full Text Sources
Miscellaneous
