. 2012 Nov 15;63(3):1107-18.
doi: 10.1016/j.neuroimage.2012.08.042. Epub 2012 Aug 21.

Data-driven analysis of analogous brain networks in monkeys and humans during natural vision

Affiliations

Data-driven analysis of analogous brain networks in monkeys and humans during natural vision

Dante Mantini et al. Neuroimage. .

Abstract

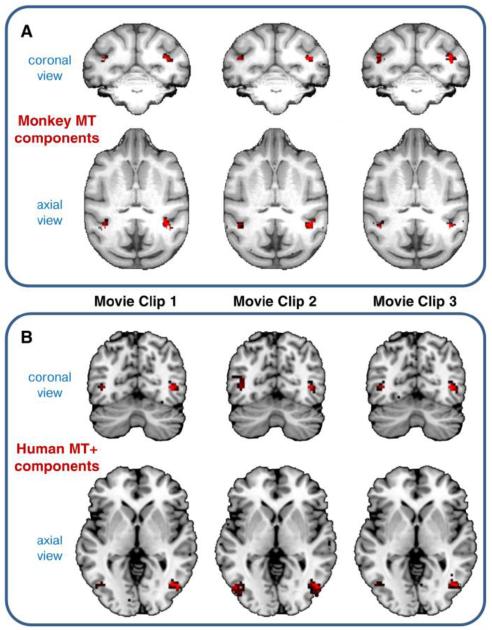
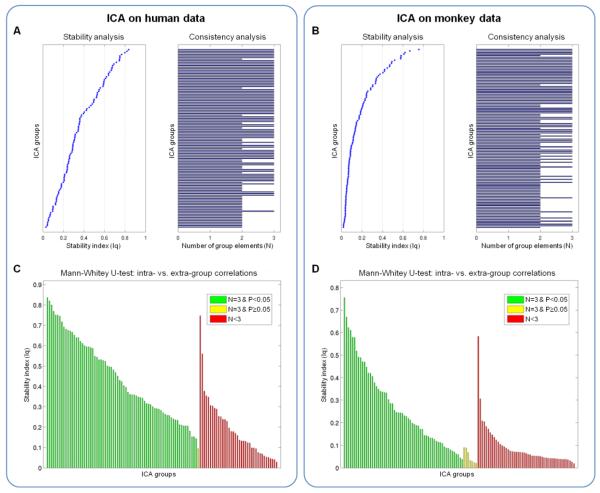
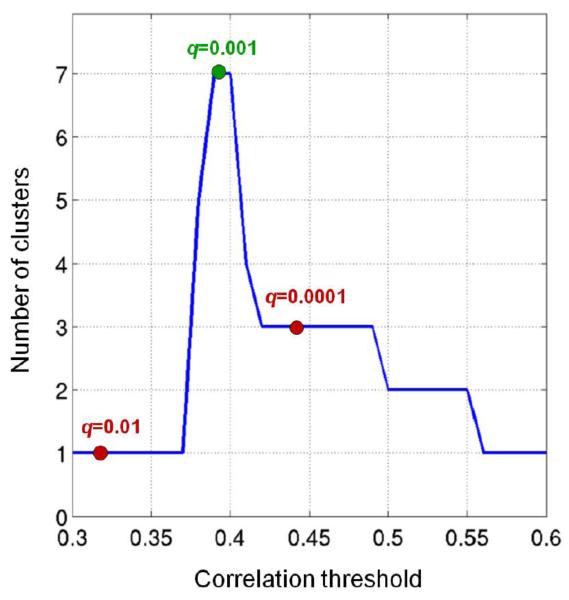
Inferences about functional correspondences between functional networks of human and non-human primates largely rely on proximity and anatomical expansion models. However, it has been demonstrated that topologically correspondent areas in two species can have different functional properties, suggesting that anatomy-based approaches should be complemented with alternative methods to perform functional comparisons. We have recently shown that comparative analyses based on temporal correlations of sensory-driven fMRI responses can reveal functional correspondent areas in monkeys and humans without relying on spatial assumptions. Inter-species activity correlation (ISAC) analyses require the definition of seed areas in one species to reveal functional correspondences across the cortex of the same and other species. Here we propose an extension of the ISAC method that does not rely on any seed definition, hence a method void of any spatial assumption. Specifically, we apply independent component analysis (ICA) separately to monkey and human data to define species-specific networks of areas with coherent stimulus-related activity. Then, we use a hierarchical cluster analysis to identify ICA-based ISAC clusters of monkey and human networks with similar timecourses. We implemented this approach on fMRI data collected in monkeys and humans during movie watching, a condition that evokes widespread sensory-driven activity throughout large portions of the cortex. Using ICA-based ISAC, we detected seven monkey-human clusters. The timecourses of several clusters showed significant correspondences either with the motion energy in the movie or with eye-movement parameters. Five of the clusters spanned putative homologous functional networks in either primary or extrastriate visual regions, whereas two clusters included higher-level visual areas at topological locations that are not predicted by cortical surface expansion models. Overall, our ICA-based ISAC analysis complemented the findings of our previous seed-based investigations, and suggested that functional processes can be executed by brain networks in different species that are functionally but not necessarily anatomically correspondent. Overall, our method provides a novel approach to reveal evolution-driven functional changes in the primate brain with no spatial assumptions.


Figures

Figure 1
Figure 1. Data-driven analysis of monkey-human functional correspondences
The schematic representation illustrates the analysis pipeline for detecting monkey and human independent components with similar functional processing. First, independent component analysis is used separately on the monkey and human fMRI data. The timecourses of the resulting independent components (ICs) in monkeys and humans are compared by Pearson’s correlation. The ICs with at least one significant inter-species correlation are selected for hierarchical cluster analysis. The resulting dendrogram is cut to include at least one monkey and one human IC (see dashed line).
Figure 2
Figure 2. Example of monkey and human ICs detected for different movie clips
Corresponding ICs from the three movie clips are clustered together by means of the sogICA approach. (A) Three monkey ICs mainly including the middle temporal area (monkey MT). (B) Three human ICs mainly including the middle temporal complex (human MT+). IC spatial maps are thresholded at Z>2 for visualization purposes.
Figure 3
Figure 3. Analysis of ICA clusters from monkey and human data
ICA decomposition was performed on monkey and human data, separately for each of the three movie clips. Spatial cluster analysis was performed, based on the self-organizing group ICA (sogICA) approach, to match corresponding ICs. Stability and consistency were assessed for all (A) monkey and (B) human ICA clusters. We measured the cluster stability as the difference between intra- and extra-cluster correlations, and the cluster consistency by the number of cluster elements (N ≤ 3). For inter-species comparisons, we selected the (C) monkey and (D) human ICA clusters with full consistency across movie clips (N=3) and with significant difference between intra- and extra-cluster correlations (Mann-Whitney U-test, P<0.05). The selected ICA clusters are colored in green.
Figure 4
Figure 4. Consistent monkey and human ICs revealed by the species-specific clustering
The spatial maps show the cortical coverage of monkey and human ICs with full consistency across movie clips (N=3) and significant difference between intra- and extra-cluster correlations (Mann-Whitney U-test, P<0.05), as reported in Figure 3. The ICs are thresholded at Z>2, binarized and summed to generate consistency maps. Boundaries of visuotopic areas are superimposed over the cortex. (A) The consistency map for monkey ICs is shown over a representative monkey cortex. (B) The same consistency map for monkey ICs is shown over a representative human cortex, by using a computational model for monkey-to-human cortical alignment (Van Essen and Dierker, 2007). (C) The consistency map for human ICs is shown over a representative human cortex.
Figure 5
Figure 5. Analysis of correlation thresholds for the data-driven inter-species analysis
The number of clusters containing monkey and human ICs is plotted for different values of the correlation threshold (assessed between 0.3 and 0.6 at steps of 0.01). The values for correlations corresponding to an FDR of q=0.01, q=0.001 and q=0.0001 are marked with a circle. The selected configuration (FDR of q=0.001) is indicated in green, the remaining ones in red.
Figure 6
Figure 6. Clustering of monkey and human ICs with similar temporal profile
(A) A cross-correlation matrix is computed on the monkey and human IC timecourses. (B) The cross-correlation matrix is thresholded to delineate monkey and human ICs with correlated (FDR of q=0.001) timecourses. (C) The selected timecourses are subjected to hierarchical cluster analysis, using temporal correlation as a similarity metric. (D) The dendrogram is cut to delineate clusters with a least one monkey IC and one human IC. (E) Seven monkey-human IC clusters are defined, and the strength of the intra- and inter-cluster correlations is assessed. (F) Two-dimensional multidimensional scaling (MDS) plot for the seven monkey-human IC clusters. The ICs belonging to the same cluster are labeled with the same color.
Figure 7
Figure 7. Timecourses and spatial maps of monkey-human IC clusters
(A) For each of the 7 clusters, the timecourses of the constituent monkey and human IC are plotted in different colors, whereas their average (representative of the whole cluster) is indicated by a thick black line. (B-H) Monkey and human IC spatial maps in each of the 7 clusters are represented (Z>2) in different colors on a flattened monkey and human cortex, respectively. The IC labels (e.g., IC m44 and IC h54 for cluster 1) correspond to the numbers of the IC clusters retrieved from monkey and human data, respectively. (I) Colorbars illustrating the relationship between the colors and the value range in the flat maps.
Figure 8
Figure 8. Clustering of timecourses from voxels belonging to selected monkey and human ICs
We extracted fMRI timecourses from the voxels included in the monkey and human ICs showing significant inter-species activity correlation (shown in Fig. 7B-H). Next, we performed a hierarchical cluster analysis on them, to define 7 clusters as in the inter-species ICA-based analysis (see Supplementary Fig. 2). (A) The voxel-based clusters are spatially represented with different color code over a monkey and a human flattened cortex. (B) We measured the spatial overlap between the seven ICA-based clusters (Fig. 7B-H) and the seven voxel-based clusters (Fig. 8A), separately for the monkey and human maps.

Similar articles

Cited by

References

    1. Anderson ML. Neural reuse: a fundamental organizational principle of the brain. Behav.Brain Sci. 2010;33:245–266. - PubMed
    1. Bartels A, Zeki S. The chronoarchitecture of the cerebral cortex. Philos.Trans.R.Soc.Lond B Biol.Sci. 2005;360:733–750. - PMC - PubMed
    1. Bartels A, Zeki S, Logothetis NK. Natural vision reveals regional specialization to local motion and to contrast-invariant, global flow in the human brain. Cereb.Cortex. 2008;18:705–717. - PubMed
    1. Beauchemin SS, Barron JL. The computation of optical flow. ACM Computing Surveys (CSUR) 1995;27:433–466.
    1. Calhoun VD, Adali T, Pearlson GD, Pekar JJ. A method for making group inferences from functional MRI data using independent component analysis. Hum.Brain Mapp. 2001;14:140–151. - PMC - PubMed

Publication types