. 2012 Sep 27;489(7417):513-8.
doi: 10.1038/nature11514. Epub 2012 Sep 19.

Genomic analysis of a key innovation in an experimental Escherichia coli population

Affiliations

Genomic analysis of a key innovation in an experimental Escherichia coli population

Zachary D Blount et al. Nature. .

Abstract

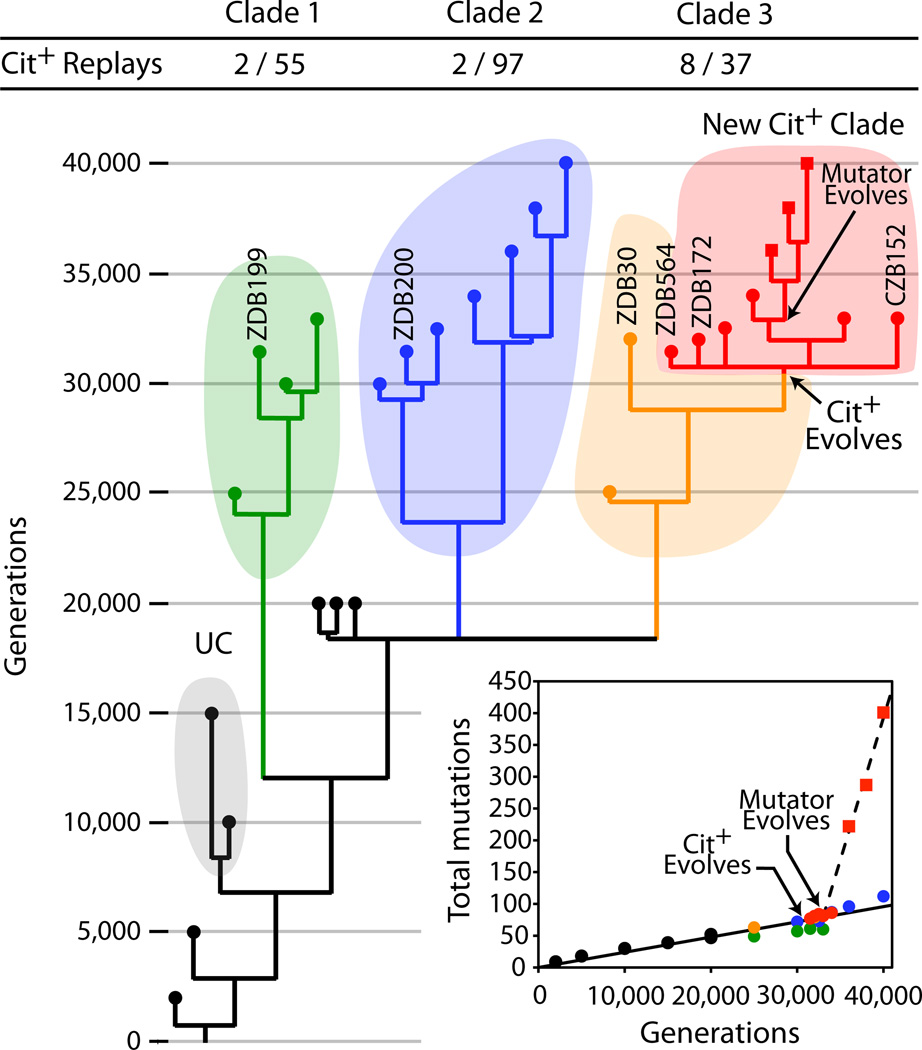
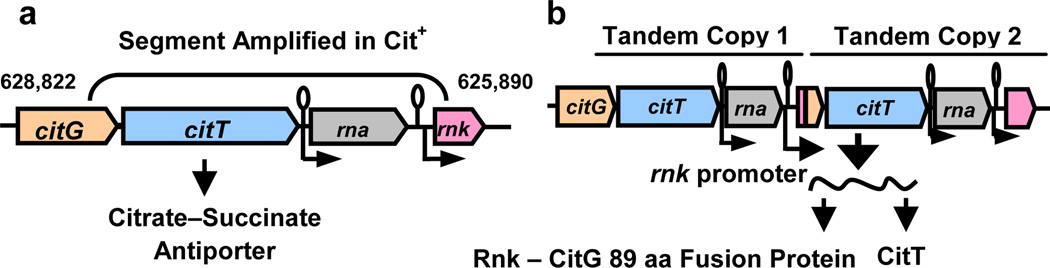
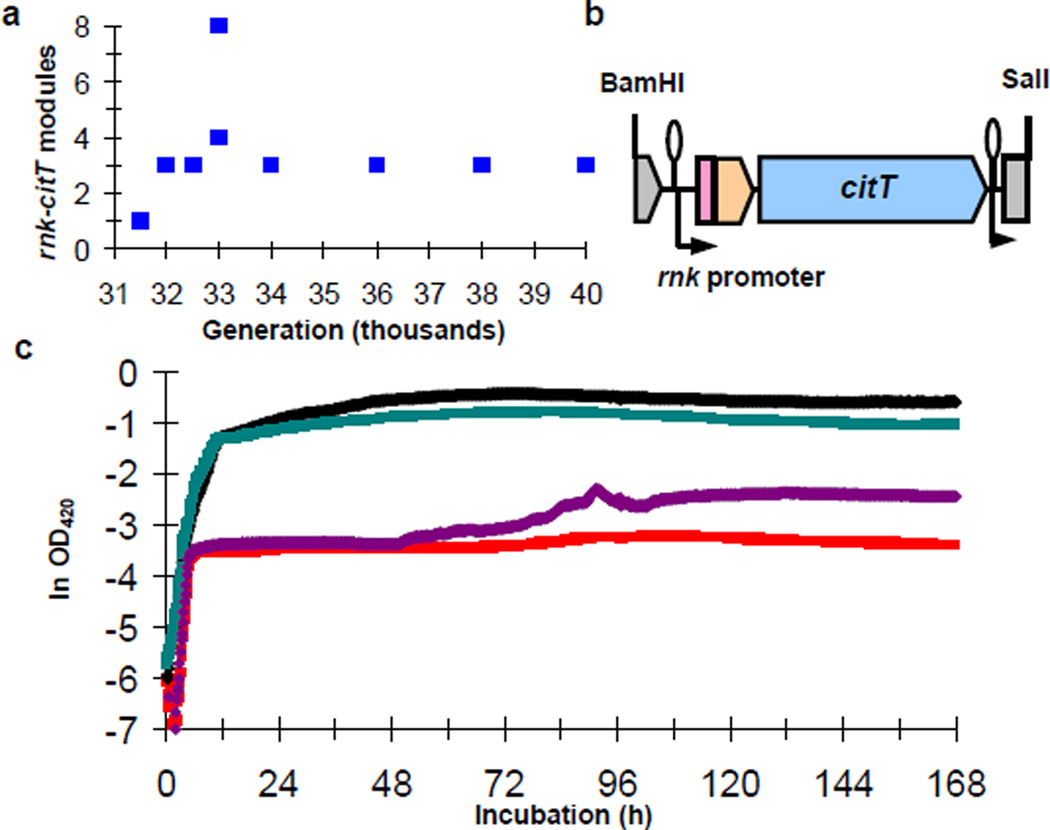
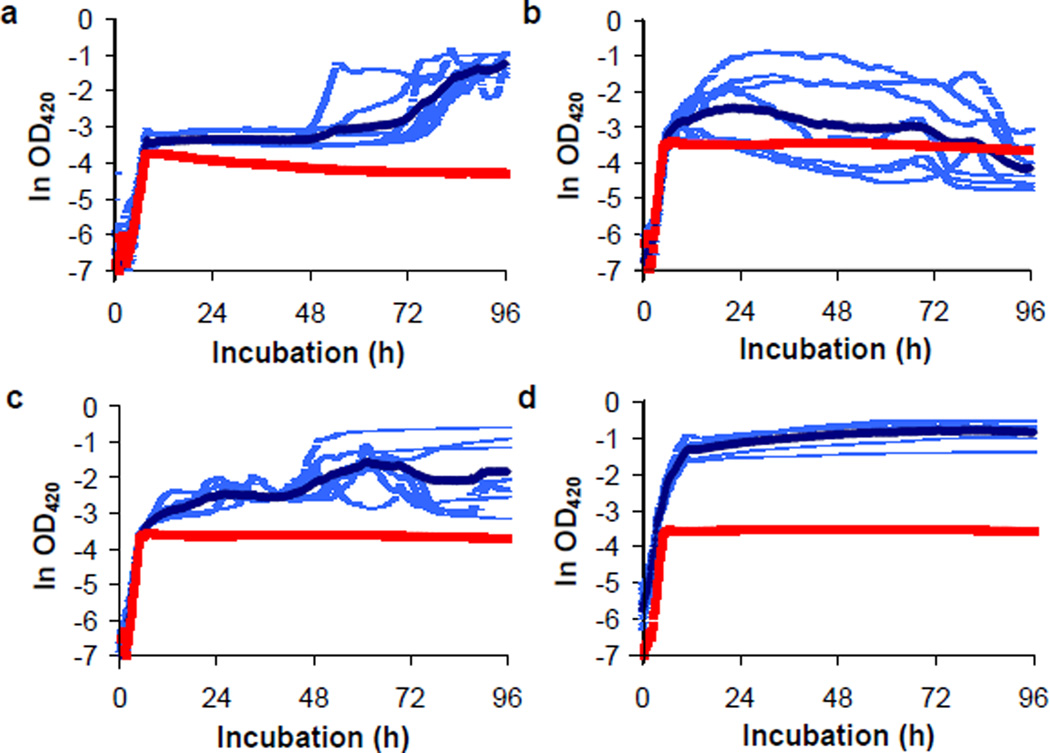
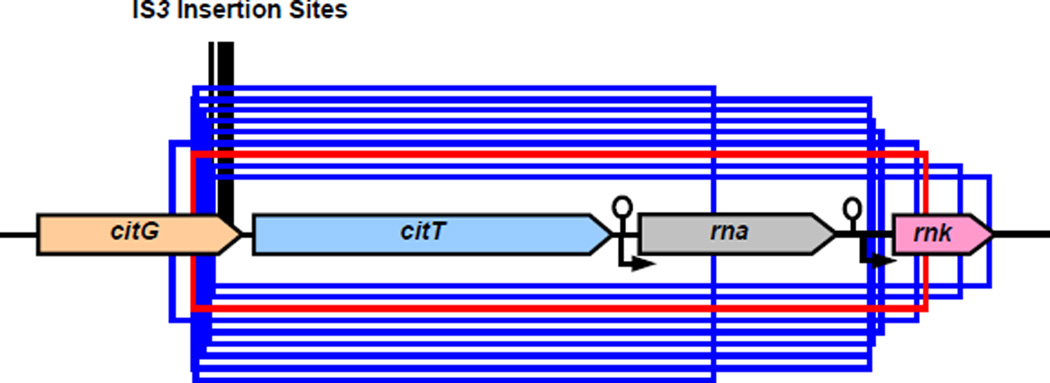
Evolutionary novelties have been important in the history of life, but their origins are usually difficult to examine in detail. We previously described the evolution of a novel trait, aerobic citrate utilization (Cit(+)), in an experimental population of Escherichia coli. Here we analyse genome sequences to investigate the history and genetic basis of this trait. At least three distinct clades coexisted for more than 10,000 generations before its emergence. The Cit(+) trait originated in one clade by a tandem duplication that captured an aerobically expressed promoter for the expression of a previously silent citrate transporter. The clades varied in their propensity to evolve this novel trait, although genotypes able to do so existed in all three clades, implying that multiple potentiating mutations arose during the population's history. Our findings illustrate the importance of promoter capture and altered gene regulation in mediating the exaptation events that often underlie evolutionary innovations.


Figures

Figure 1
Figure 1. Phylogeny of Ara–3 population
Symbols at branch tips mark 29 sequenced clones; labels are shown for clones mentioned in main text and figures. Shaded areas and coloured symbols identify major clades. Fractions above the tree show the number of clones belonging to the clade that yielded Cit+ mutants during replay experiments (numerator) and the corresponding total used in those experiments (denominator). Inset shows number of mutations relative to the ancestor. The solid line is the least-squares linear regression of mutations in non-mutator genomes; the dashed line is the corresponding regression for mutator genomes.
Figure 2
Figure 2. Tandem amplification in Cit+ genomes
a. Ancestral arrangement of citG, citT, rna, and rnk genes. b. Altered spatial and regulatory relationships generated by the amplification.
Figure 3
Figure 3. Expression levels from native citT, native rnk, and evolved rnk-citT regulatory regions during aerobic metabolism
Average timecourse of expression for the ancestral strain REL606 (left) and evolved clones ZDB30 (center) and ZDB172 (right), each transformed with reporter plasmids pCDcitTlux (blue), pCDrnklux (black) and pCDrnk-citTlux (red). Each curve shows the average of four replicates.
Figure 4
Figure 4. New rnk-citT module confers Cit+ phenotype in potentiated background
a. Engineered construct containing the cit amplification junction with the rnk promoter, and the arrangement following its insertion into the chromosome. b. Average growth trajectories in DM25 of potentiated clone ZDB30 (red), its isogenic construct with chromosomal integration of the rnk-cit module ZDB595 (blue), 31,500-generation Cit+ clone ZDB564 (purple), and 32,000-generation Cit+ clone ZDB172 (green). c. Trajectories of ZDB595 compared to its parent. Light blue trajectories show heterogeneity among replicate cultures of ZDB595; dark blue and red are averages for ZDB595 and its parent, ZDB30, as in panel b (except different scale).
Figure 5
Figure 5. Refinement of Cit+ phenotype by increased number of rnk-citT modules
a. Change in rnk-citT module copy number in sequenced Cit+ clones over time. b. Structure of rnk-citT module cloned into high-copy plasmid pUC19 to produce pZBrnk-citT. c. Growth trajectories in DM25 of potentiated Cit clone ZDB30 (red), 31,500-generation Cit+ clone ZDB564 (purple), 33,000-generation Cit+ clone CZB152 (black), and ZDB612, a pZBrnk-citT transformant of ZDB30 (green). Each trajectory is the average of six replicates.
Figure 6
Figure 6. Evidence for epistatic interactions in potentiation of Cit+ phenotype
Growth trajectories in DM25 of diverse clones transformed with the pZBrnk-citT plasmid. a. Ancestral strain REL606 and its transformant ZDB611. b. Clade C1 clone ZDB199 and its transformant ZDB614. c. C2 clone ZDB200 and its transformant ZDB615. d. C3 clone ZDB30 and its transformant ZDB612. Red and dark blue trajectories are averages for the parent clone and its transformant; light blue trajectories show the replicates for the transformant.
Figure 7
Figure 7. Mutations that produced Cit+ phenotype in 14 replay experiments
The red box shows the boundaries of the 2,933-bp amplified segment that actualized the Cit+ function in the original long-term population. Blue boxes show citT-containing regions amplified in 8 replays that produced Cit+ mutants. Vertical black lines mark 5 locations where IS3 insertions produced Cit+ mutants in 6 other replays.

Comment in

References

    1. Mayr E. The emergence of evolutionary novelties. In: Tax S, editor. Evolution after Darwin. Chicago: University of Chicago Press; 1960.
    1. Pigliucci M. What, if anything, is an evolutionary novelty? Philos. Science. 2008;75:887–898.
    1. Jacob F. Evolution and tinkering. Science. 1977;196:1161–1166. - PubMed
    1. Jacob F. The Possible and the Actual. Seattle: Univ. Washington Press; 1982.
    1. Gould SJ, Vrba ES. Exaptation – a missing term in the science of form. Paleobiol. 1982;8:4–15.

Publication types

MeSH terms