. 2012 Nov 2;287(45):37793-807.
doi: 10.1074/jbc.M112.414078. Epub 2012 Sep 19.

Direct tests of enzymatic heme degradation by the malaria parasite Plasmodium falciparum

Affiliations

Direct tests of enzymatic heme degradation by the malaria parasite Plasmodium falciparum

Paul A Sigala et al. J Biol Chem. .

Abstract

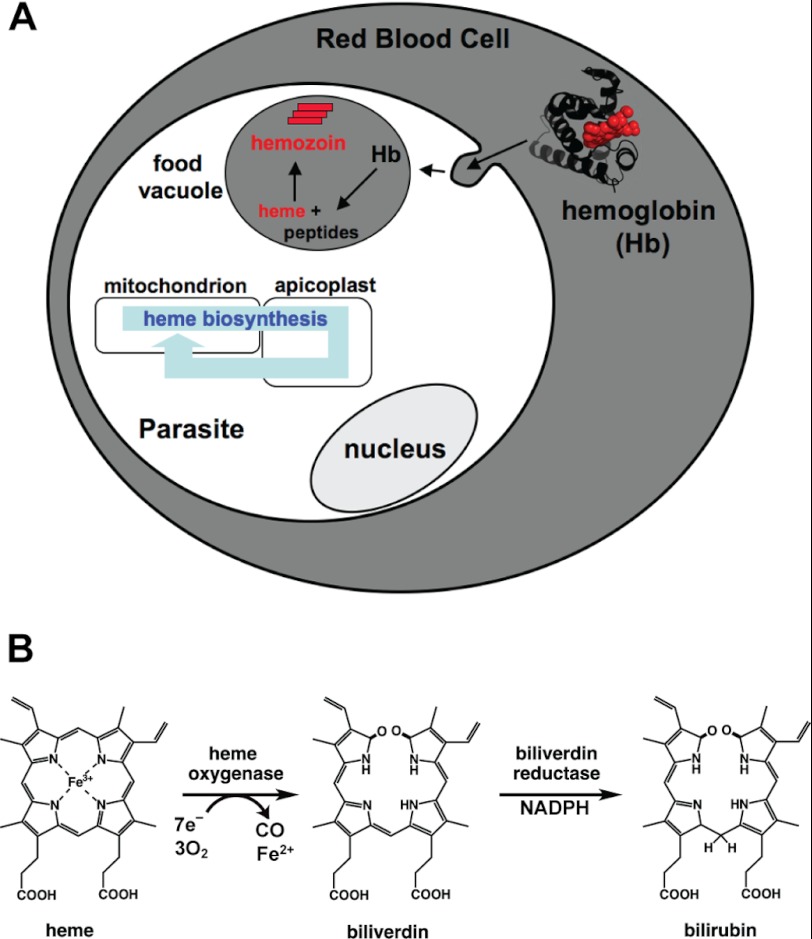
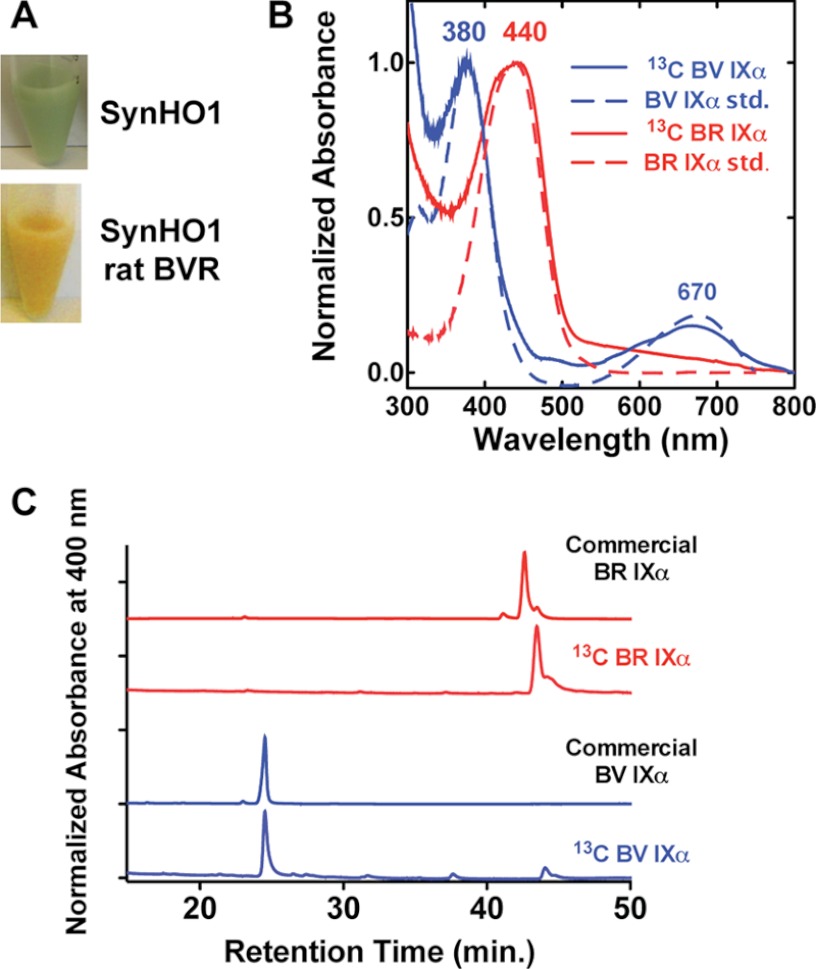
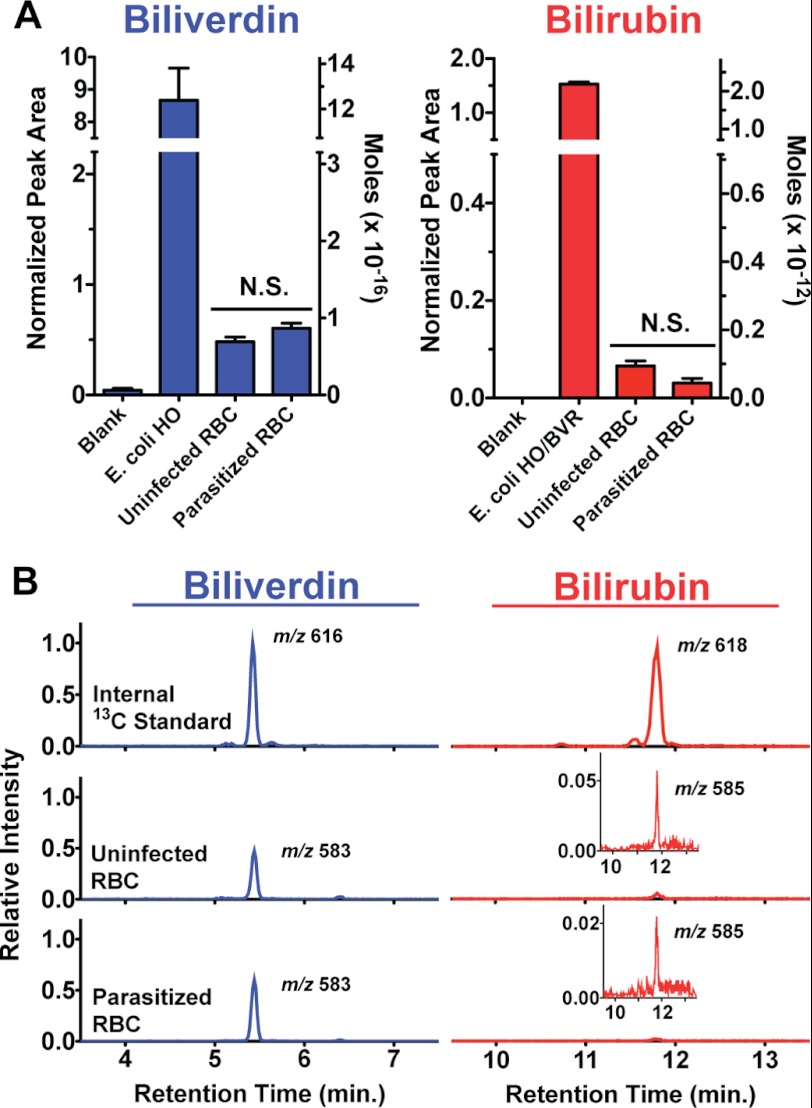
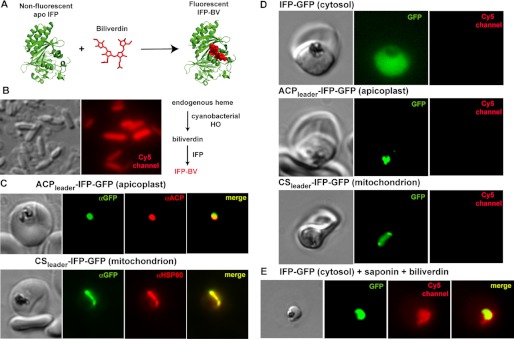
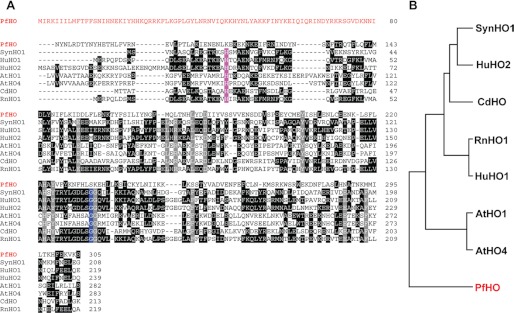
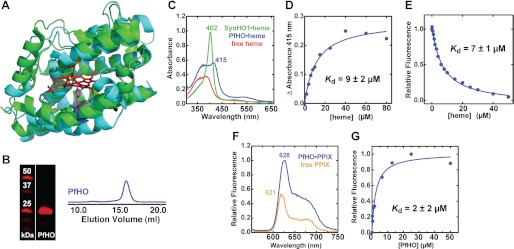
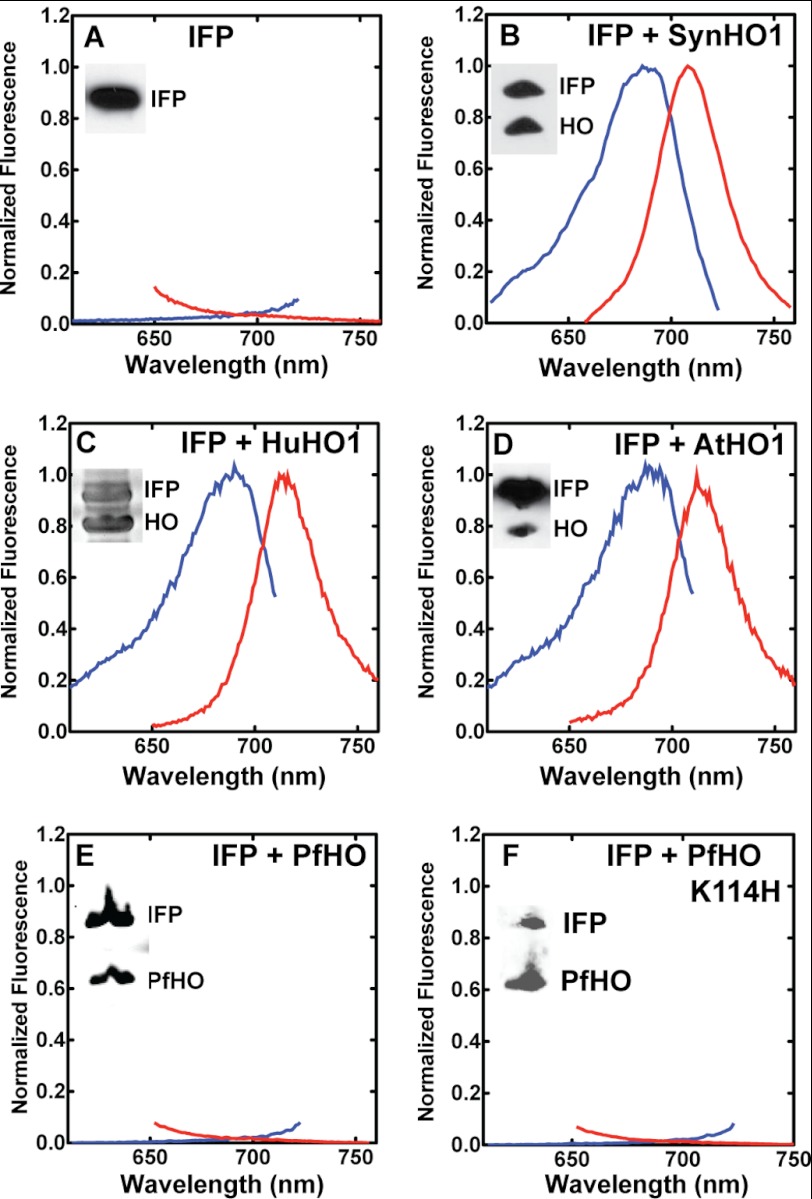
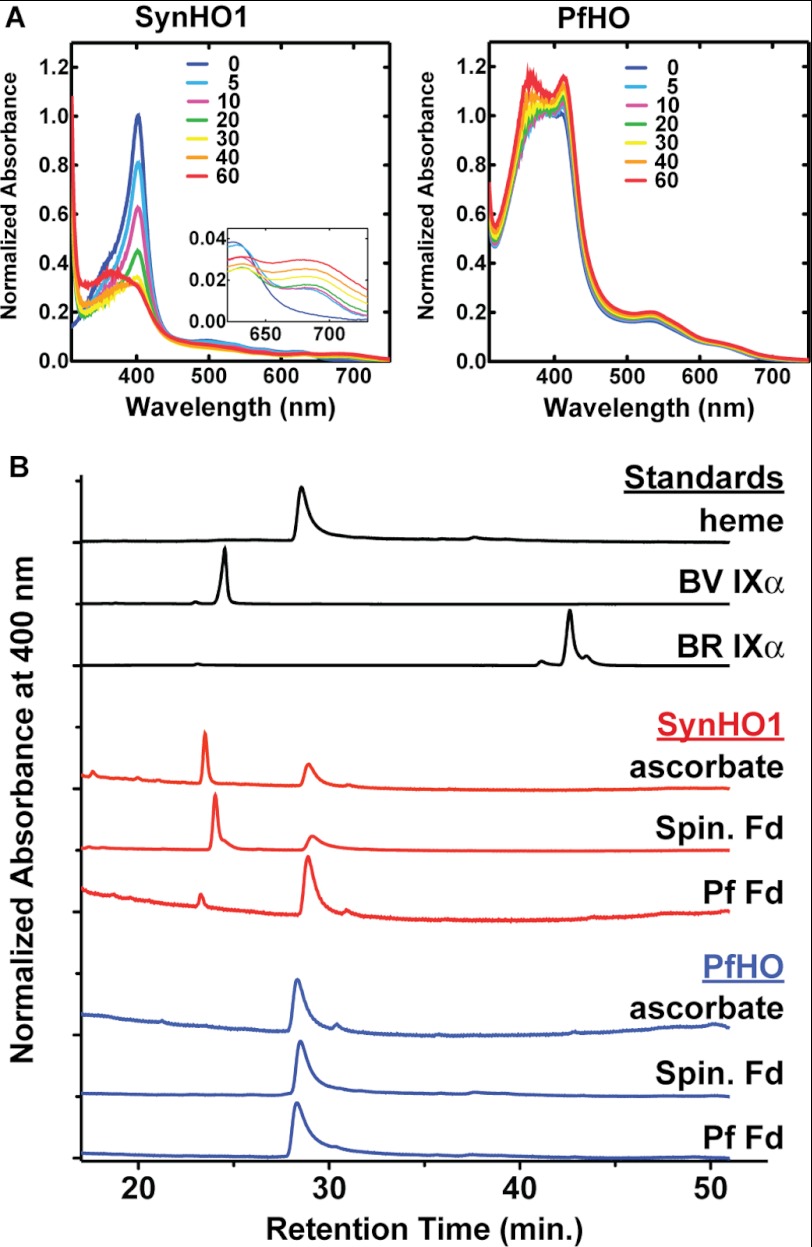
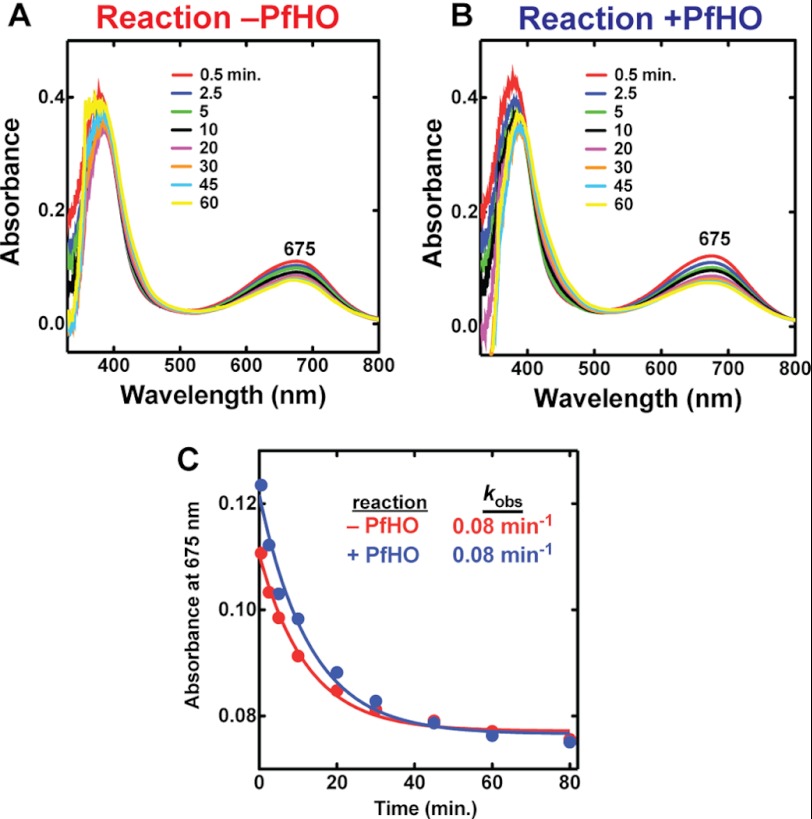
Malaria parasites generate vast quantities of heme during blood stage infection via hemoglobin digestion and limited de novo biosynthesis, but it remains unclear if parasites metabolize heme for utilization or disposal. Recent in vitro experiments with a heme oxygenase (HO)-like protein from Plasmodium falciparum suggested that parasites may enzymatically degrade some heme to the canonical HO product, biliverdin (BV), or its downstream metabolite, bilirubin (BR). To directly test for BV and BR production by P. falciparum parasites, we DMSO-extracted equal numbers of infected and uninfected erythrocytes and developed a sensitive LC-MS/MS assay to quantify these tetrapyrroles. We found comparable low levels of BV and BR in both samples, suggesting the absence of HO activity in parasites. We further tested live parasites by targeted expression of a fluorescent BV-binding protein within the parasite cytosol, mitochondrion, and plant-like plastid. This probe could detect exogenously added BV but gave no signal indicative of endogenous BV production within parasites. Finally, we recombinantly expressed and tested the proposed heme degrading activity of the HO-like protein, PfHO. Although PfHO bound heme and protoporphyrin IX with modest affinity, it did not catalyze heme degradation in vivo within bacteria or in vitro in UV absorbance and HPLC assays. These observations are consistent with PfHO's lack of a heme-coordinating His residue and suggest an alternative function within parasites. We conclude that P. falciparum parasites lack a canonical HO pathway for heme degradation and thus rely fully on alternative mechanisms for heme detoxification and iron acquisition during blood stage infection.


Figures

FIGURE 1.
FIGURE 1.
Pathways for heme generation in parasites and enzymatic heme degradation. A, intraerythrocytic parasites generate heme by proteolytic degradation of host hemoglobin in the digestive food vacuole and by de novo biosynthesis coordinated between the mitochondrion, apicoplast, and cytosol. For simplicity, all membranes are shown as single layers and hemoglobin is depicted as a monomer. B, enzymatic heme degradation proceeds via cleavage of the porphyrin ring by a heme oxygenase to generate biliverdin IXα, which can then be reduced by a biliverdin reductase to form bilirubin IXα.
FIGURE 2.
FIGURE 2.
Characterization of enzymatically produced 13C-labeled BV and BR mass spectrometry standards. 13C-Labeled BV IXα and BR IXα produced in E. coli by overexpression of SynHO1 or SynHO1 plus rat BVR turned bacteria the expected green or orange color due to accumulation of each tetrapyrrole (A). The DMSO-extracted tetrapyrroles had nearly identical UV-visible absorbance spectra (B) and reverse-phase C18 HPLC retention times (C) as commercial BV IXα and BR IXα standards.
FIGURE 3.
FIGURE 3.
LC-MS/MS measurement of biliverdin and bilirubin in parasite-infected versus uninfected red blood cells. Cells were extracted in DMSO, known amounts of 13C-labeled BV and BR internal standards were added, and samples were analyzed by LC-MS/MS. The integrated area of the BV and BR peak detected for each sample was normalized against the respective peak area for each internal standard. The average normalized peak area and standard error from four independently prepared and processed replicates are shown in A, and representative mass spectra with indicated [M + H]+ masses are shown in B. N.S. = not significantly different by unpaired t test (p = 0.11 [BV], 0.05 [BR]). The insets in B are expanded y axis views of the detected peaks. Estimated molar amounts of each analyte detected in injected samples have been included on the right y axis in A to facilitate comparison between BV and BR levels, as the normalized peak areas for the two analytes cannot be directly compared due to differing amounts of BV and BR internal standards added to samples (see “Experimental Procedures”).
FIGURE 4.
FIGURE 4.
Targeted episomal expression of a fluorescent biliverdin biosensor in P. falciparum parasites. A, unliganded and nonfluorescent IFP covalently binds free biliverdin to generate mature IFP-BV, whose fluorescence can be detected on the Cy5 channel. This scheme was constructed using the BV-bound x-ray structure of the D. radiodurans chromophore binding domain (Protein Data Bank code 3S7O), from which IFP is derived. B, heterologous co-expression of SynHO1 and IFP in E. coli enables in situ fluorescence detection of the BV product of SynHO1 within live bacteria imaged on the Cy5 channel of a fluorescence microscope. C, immunofluorescence microscopy of fixed parasites confirms apicoplast and mitochondrial targeting of episomally expressed IFP bearing a C-terminal GFP tag and the N-terminal leader sequence from either acyl carrier protein (ACP) or citrate synthase (CS), respectively. Parasites were stained with monoclonal αGFP and either a polyclonal αACP (apicoplast) or αHSP60 (mitochondrion) antibodies. The epitope recognized by the αACP antibody is distinct from the ACP leader sequence. D, fluorescence images of live parasites episomally expressing IFP within the parasite cytoplasm, apicoplast, or mitochondrion. E, fluorescence image of a live parasite expressing cytosolic IFP-GFP. The parasite was released from its host RBC via saponin treatment and incubated in exogenous biliverdin. Images on GFP and Cy5 channels were processed with identical brightness and contrast settings.
FIGURE 5.
FIGURE 5.
Sequence analysis of PfHO relative to known heme oxygenases. A, ClustalW alignment of PfHO with known heme oxygenases from Synechocystis sp. 6803 (SynHO1), H. sapiens (HuHO1 and HuHO2), A. thaliana (AtHO1 and AtHO4), Corynebacterium diphtheriae (CdHO), and R. norvegicus (RnHO1). The amino acid leader sequence of PfHO is shown in red. Conserved residues in all seven known HOs are colored gray. The conserved proximal His residue that coordinates the bound heme and the conserved distal Gly residue are colored violet and blue, respectively. Identical residues in three or more proteins are in black. For simplicity, the chloroplast-targeting leader sequences of AtHO1 and AtHO4 and sequences of all proteins that extend beyond the C terminus of PfHO have been omitted. B, phylogenetic relationship of PfHO relative to the aligned heme oxygenases.
FIGURE 6.
FIGURE 6.
Heme binding by PfHO versus SynHO1. A, structural alignment of the x-ray crystallographic model of SynHO1 containing bound heme (green, Protein Data Bank code 1WE1) with the Rosetta-derived model of the HO domain of PfHO (cyan) (root mean square deviation = 1.4 Å). The bound heme is shown in red; the distal Gly residue and the proximal His ligand of SynHO1 are shown in orange and violet, respectively, and the aligned Lys residue in PfHO is shown in blue. B, Coomassie-stained SDS-polyacrylamide gel and gel filtration chromatogram of purified PfHO. C, UV-visible absorbance spectrum of 10 μm heme free in solution (red) or bound to 20 μm SynHO1 (green) or 200 μm PfHO (blue). D, heme binding to 2 μm PfHO leads to a saturable absorbance increase at 415 nm. Plotting this increase as a function of heme concentration and fitting with a quadratic binding equation (R2 = 0.98) gives an apparent dissociation constant (Kd) of 9 ± 2 μm. E, heme binding to PfHO leads to quenching of endogenous Trp fluorescence at 387 nm. Fitting this fluorescence decrease with a quadratic binding equation (R2 = 0.99) gives an apparent affinity of 7 ± 1 μm. F, fluorescence emission spectrum (excitation 400 nm) of 10 μm PPIX free in solution (orange) or bound to 20 μm PfHO (blue). G, binding of 0.1 μm PPIX to PfHO leads to a saturable increase in PPIX fluorescence intensity. Plotting the fluorescence increase at 628 nm versus PfHO concentration and fitting with a quadratic binding equation (R2 = 0.97) yields an apparent Kd of 2 ± 2 μm.
FIGURE 7.
FIGURE 7.
Testing HO activity in E. coli by co-expression with IFP. Fluorescence excitation (blue, emission at 730 nm) and emission (red, excitation at 630 nm) spectra of clarified bacterial lysates expressing IFP only (A), IFP and SynHO1 (B), IFP and HuHO1 (C), IFP and AtHO1 (D), IFP and PfHO (E), or IFP and PfHO K114H (F). The inset in each spectrum is an α-polyhistidine Western blot of lysate supernatants confirming soluble expression of the indicated proteins, except C, which is a Coomassie-stained gel of the clarified lysate as the HuHO1 was not His-tagged.
FIGURE 8.
FIGURE 8.
In vitro HO activity of purified SynHO1 versus PfHO. A, time-dependent (min) UV-visible absorbance changes of 10 μm heme bound to 20 μm SynHO1 or 100 μm PfHO. Samples contained 10 mm ascorbate, 1 μm catalase, 50 mm Tris·HCl (pH 8), and 100 mm NaCl. B, reverse-phase C18 HPLC analysis of tetrapyrrole standards or reaction products of 10 μm heme incubated with 20 μm SynHO1 or 100 μm PfHO in 50 mm Tris·HCl (pH 8), 100 mm NaCl, 1 μm catalase, and either (i) 10 mm ascorbate or (ii) 10 μm Spin. or P. falciparum (Pf) Fd, 0.025 units/ml spinach FNR, and 100 μm NADPH.
FIGURE 9.
FIGURE 9.
UV-visible absorbance spectra of biliverdin in the presence or absence of PfHO. 10 μm BV was incubated with 10 μm PfFd, 0.025 units/ml Spin. FNR, 1 μm catalase, and 100 μm NADPH in 50 mm Tris·HCl (pH 8) and 100 mm NaCl in the absence (A) or presence (B) of 100 μm PfHO. C, the time-dependent loss (min) of BV absorbance at 675 nm observed in A and B was fit to an exponential decay equation (R2 = 0.98), giving an identical rate constant (kobs) independent of whether PfHO was present or absent.

References

    1. Francis S. E., Sullivan D. J., Jr., Goldberg D. E. (1997) Hemoglobin metabolism in the malaria parasite Plasmodium falciparum. Annu. Rev. Microbiol. 51, 97–123 - PubMed
    1. van Dooren G. G., Kennedy A. T., McFadden G. I. (2012) The use and abuse of heme in apicomplexan parasites. Antioxid. Redox Signal. 17, 634–656 - PubMed
    1. Surolia N., Padmanaban G. (1992) De novo biosynthesis of heme offers a new chemotherapeutic target in the human malarial parasite. Biochem. Biophys. Res. Commun. 187, 744–750 - PubMed
    1. Nagaraj V. A., Prasad D., Rangarajan P. N., Padmanaban G. (2009) Mitochondrial localization of functional ferrochelatase from Plasmodium falciparum. Mol. Biochem. Parasitol. 168, 109–112 - PubMed
    1. Egan T. J., Combrinck J. M., Egan J., Hearne G. R., Marques H. M., Ntenteni S., Sewell B. T., Smith P. J., Taylor D., van Schalkwyk D. A., Walden J. C. (2002) Fate of heme iron in the malaria parasite Plasmodium falciparum. Biochem. J. 365, 343–347 - PMC - PubMed

Publication types

MeSH terms

LinkOut - more resources