. 2012 Oct;68(Pt 10):1371-9.
doi: 10.1107/S0907444912029599. Epub 2012 Sep 18.

Crystallization, dehydration and experimental phasing of WbdD, a bifunctional kinase and methyltransferase from Escherichia coli O9a

Affiliations

Crystallization, dehydration and experimental phasing of WbdD, a bifunctional kinase and methyltransferase from Escherichia coli O9a

Gregor Hagelueken et al. Acta Crystallogr D Biol Crystallogr. 2012 Oct.

Abstract

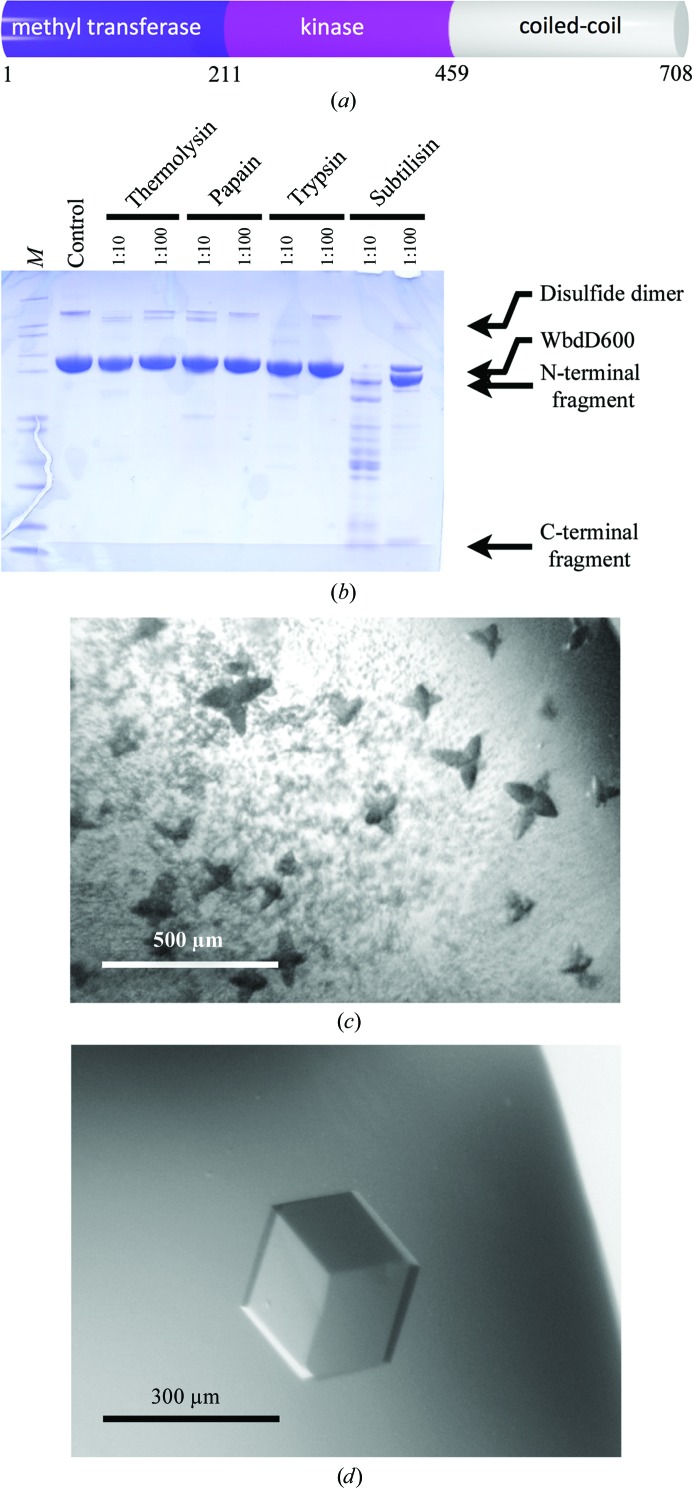
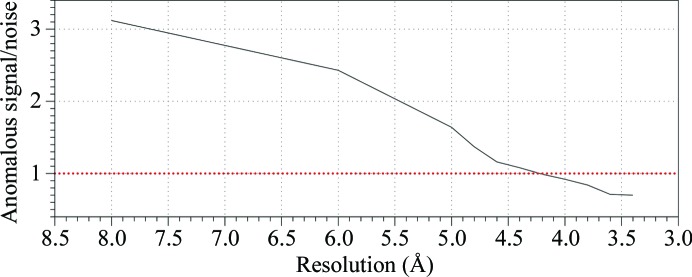
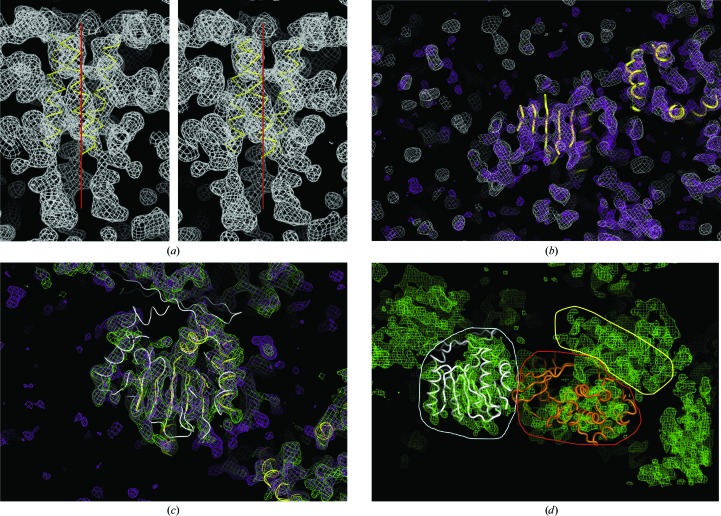
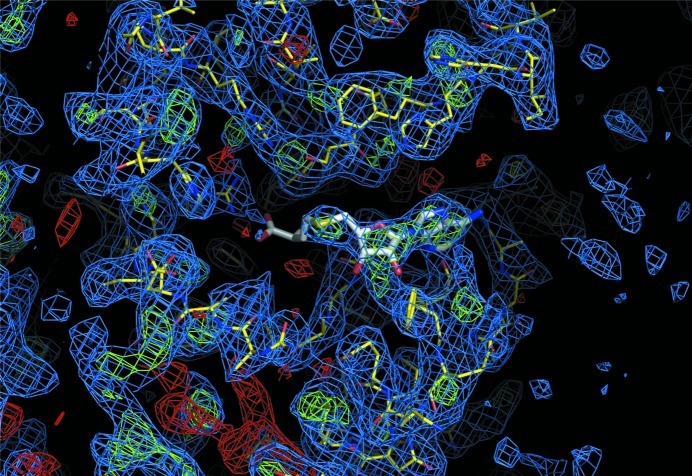
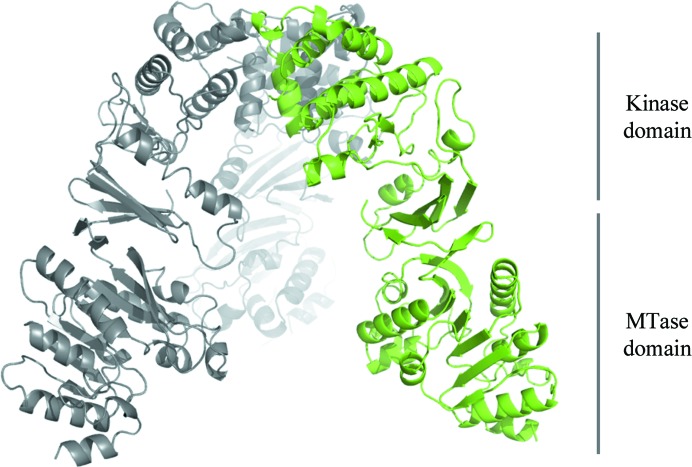
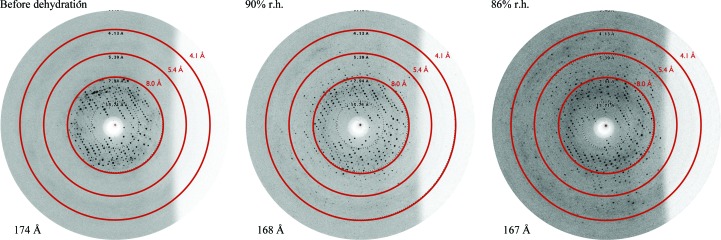
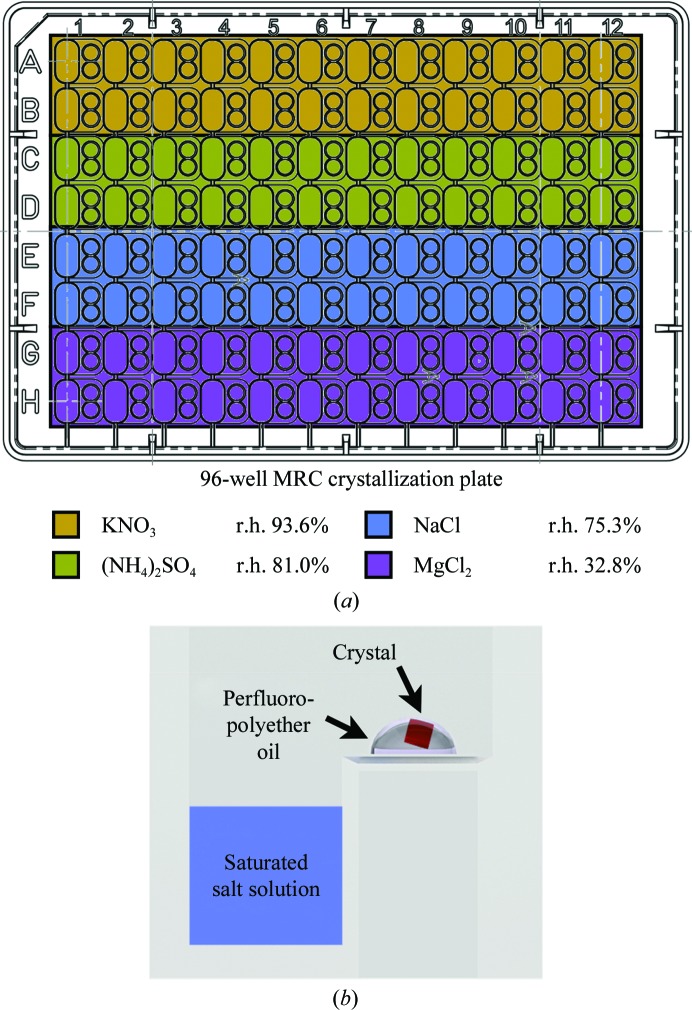
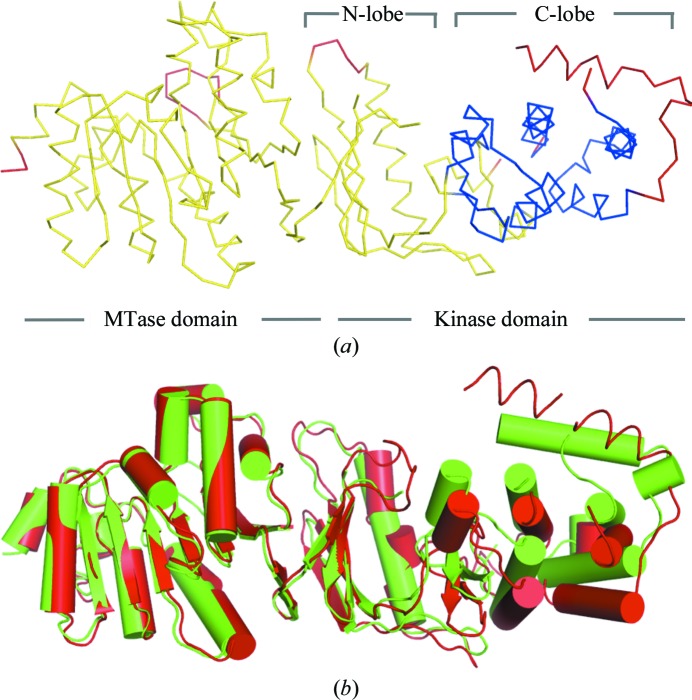
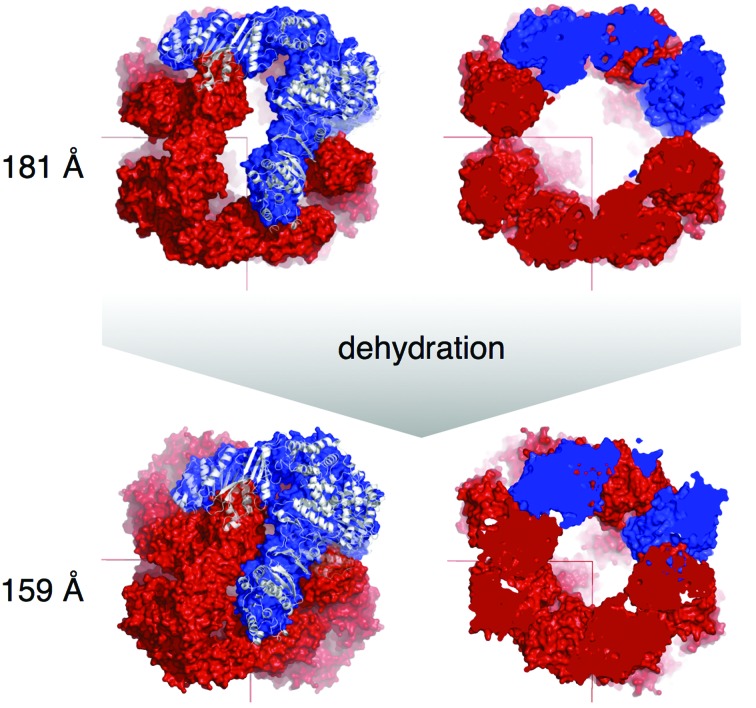
WbdD is a bifunctional kinase/methyltransferase that is responsible for regulation of lipopolysaccharide O antigen polysaccharide chain length in Escherichia coli serotype O9a. Solving the crystal structure of this protein proved to be a challenge because the available crystals belonging to space group I23 only diffracted to low resolution (>95% of the crystals diffracted to resolution lower than 4 Å and most only to 8 Å) and were non-isomorphous, with changes in unit-cell dimensions of greater than 10%. Data from a serendipitously found single native crystal that diffracted to 3.0 Å resolution were non-isomorphous with a lower (3.5 Å) resolution selenomethionine data set. Here, a strategy for improving poor (3.5 Å resolution) initial phases by density modification and cross-crystal averaging with an additional 4.2 Å resolution data set to build a crude model of WbdD is desribed. Using this crude model as a mask to cut out the 3.5 Å resolution electron density yielded a successful molecular-replacement solution of the 3.0 Å resolution data set. The resulting map was used to build a complete model of WbdD. The hydration status of individual crystals appears to underpin the variable diffraction quality of WbdD crystals. After the initial structure had been solved, methods to control the hydration status of WbdD were developed and it was thus possible to routinely obtain high-resolution diffraction (to better than 2.5 Å resolution). This novel and facile crystal-dehydration protocol may be useful for similar challenging situations.


Figures

Figure 1
Figure 1
(a) The primary structure of WbdD. The domain borders were placed according to the crystal structure of WbdD556. (b) SDS–PAGE of WbdD600 samples from limited proteolysis reactions. Lane M contains NuPAGE Mark12 protein marker (Invitrogen). The molar ratio of protease:WbdD600 is indicated. (c) Initial WbdD556 crystals (see main text for the crystallization conditions). The dark colour of the crystals arises from the Izit stain (Hampton) that was used to confirm that the crystals are protein. (d) Optimized WbdD556 crystal.
Figure 2
Figure 2
Strength 〈|F +F |/[(σF+)2 − (σF)2]1/2〉 of the anomalous signal versus resolution for the 3.5 Å resolution data set (Table 2 ▶) as calculated using SHELXC (Sheldrick, 2008 ▶). The red line at y = 0.8 indicates the threshold for the presence of an anomalous signal (Zwart, 2005 ▶).
Figure 3
Figure 3
(a) Stereo pair of an electron-density map (1.0σ) calculated with the starting experimental phases after density improvement with AUTOSOLVE (Zwart et al., 2008 ▶). The manually placed three-helix bundle is shown as a yellow tube model; the threefold crystallographic axis is indicated by a red line. (b) The white mesh represents the same map as shown in (a). The purple map was calculated from phases that were improved using PARROT. Manually placed secondary-structure elements are represented by yellow tubes. (c) The purple mesh is the same as in (b). The green map was calculated after cross-crystal averaging between the 3.5 Å resolution data set and the 4.2 Å resolution data set (Table 2 ▶) using DMMULTI (Winn et al., 2011 ▶). Manually placed secondary-structure elements are represented by yellow tubes. The crystal structure (white tubes) of the SAM-dependent methyltransferase from Pyrococcus horikoshii OT3 (PDB entry 1wzn; RIKEN Structural Genomics/Proteomics Initiative, unpublished work) is superimposed onto the manually placed secondary-structure elements. (d) The green mesh is the same as in (c). The individual domains of WbdD556 are indicated (white, methyltransferase domain; red, kinase domain; yellow, three-helix bundle).
Figure 4
Figure 4
Electron-density map (blue, 2m|F obs| − D|F calc|, 1.0σ; green, m|F obs| − D|F calc|, 3.0σ; red, m|F obs| − D|F calc|, −3.0σ) calculated from phases directly after the masked electron densities shown in Fig. 3 ▶(c) were used as a model for molecular replacement in the 3.0 Å resolution data set (Table 2 ▶). The WbdD model (yellow) and the SAM cofactor (white) are shown as sticks.
Figure 5
Figure 5
Cartoon model of the overall structure of a WbdD trimer. One monomer is coloured green and the other two are shown in grey. The relative positions of the MTase and kinase domains are indicated.
Figure 6
Figure 6
Right to left: dehydration of a WbdD556 crystal using a free-mounting system (Kiefersauer et al., 2000 ▶). As indicated, the diffraction images were taken at different relative humidities (r.h.). The images were indexed with HKL-2000 (Otwinowski & Minor, 1997 ▶) to analyze the change in the cubic unit-cell parameter.
Figure 7
Figure 7
Schematic of our novel crystal-dehydration workflow. (a) A 96-well plate was filled with different saturated salt solutions. (b) The crystal (red) was harvested from its mother liquor and placed in a drop of perfluoro­polyether oil (PFO-X175/08; Hampton Research) on the sitting-drop shelf. The plate was then sealed and the setup was kept at room temperature for a week before the crystals were harvested and flash-cooled using liquid nitrogen prior to data collection.
Figure 8
Figure 8
(a) Rigid bodies (yellow and blue ribbons) in WbdD556 identified by the RAPIDO webserver (Mosca & Schneider, 2008 ▶). Hinge regions are shown as red ribbons and the cofactors ATP and SAM as spheres. (b) Superposition of the 3.0 Å resolution (red) and 4.2 Å resolution (green) WbdD structures (Table 2 ▶) showing the twisting motion that occurs during crystal dehydration and pivots around the ATP-binding cleft. The superposition is based on the rigid body that comprises the methyltransferase and the N-lobe of the kinase domain [coloured yellow in (a)].
Figure 9
Figure 9
Effect of dehydration on the trimeric WbdD structure and the crystal packing. The top row shows the packing of the non-dehydrated crystal and the bottom row that of the dehydrated crystal. One of the four WbdD556 trimers (surface representation) which are centred around each unit-cell corner is shown in blue with a superimposed cartoon representation of the protein (white). In the figure at the top right, the pyramid-shaped assembly shown on the left is cut open to reveal the size of the internal hollow space.

References

    1. Adams, P. D., Grosse-Kunstleve, R. W., Hung, L.-W., Ioerger, T. R., McCoy, A. J., Moriarty, N. W., Read, R. J., Sacchettini, J. C., Sauter, N. K. & Terwilliger, T. C. (2002). Acta Cryst. D58, 1948–1954. - PubMed
    1. Chen, V. B., Arendall, W. B., Headd, J. J., Keedy, D. A., Immormino, R. M., Kapral, G. J., Murray, L. W., Richardson, J. S. & Richardson, D. C. (2010). Acta Cryst. D66, 12–21. - PMC - PubMed
    1. Chotiyarnwong, P., Stewart-Jones, G. B., Tarry, M., Dejnirattisai, W., Siebold, C., Koch, M., Stuart, D. I., Harlos, K., Malasit, P., Screaton, G., Mongkolsapaya, J. & Jones, E. Y. (2007). Acta Cryst. F63, 386–392. - PMC - PubMed
    1. Clarke, B. R., Cuthbertson, L. & Whitfield, C. (2004). J. Biol. Chem. 279, 35709–35718. - PubMed
    1. Clarke, B. R., Greenfield, L. K., Bouwman, C. & Whitfield, C. (2009). J. Biol. Chem. 284, 30662–30672. - PMC - PubMed

Publication types

MeSH terms

Substances