. 2012 Dec;124(6):797-807.
doi: 10.1007/s00401-012-1047-8. Epub 2012 Sep 21.

Amyloid plaque formation precedes dendritic spine loss

Affiliations

Amyloid plaque formation precedes dendritic spine loss

Tobias Bittner et al. Acta Neuropathol. 2012 Dec.

Abstract

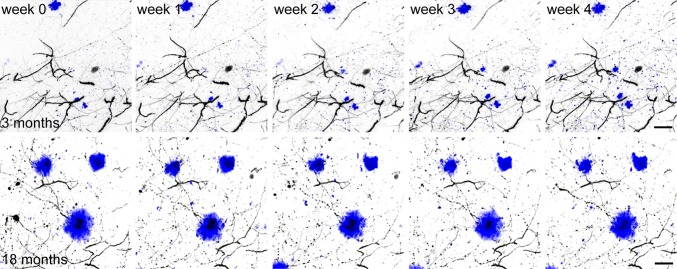
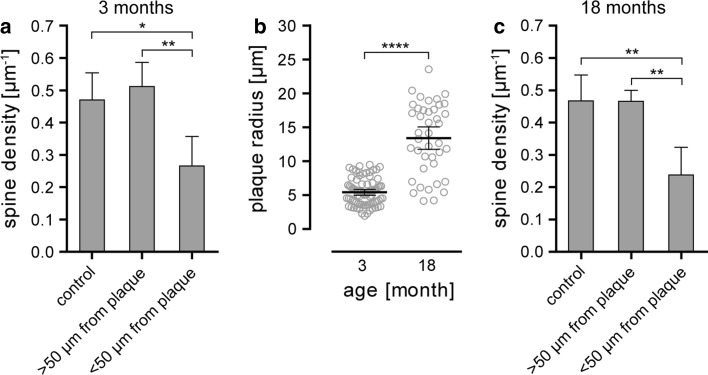
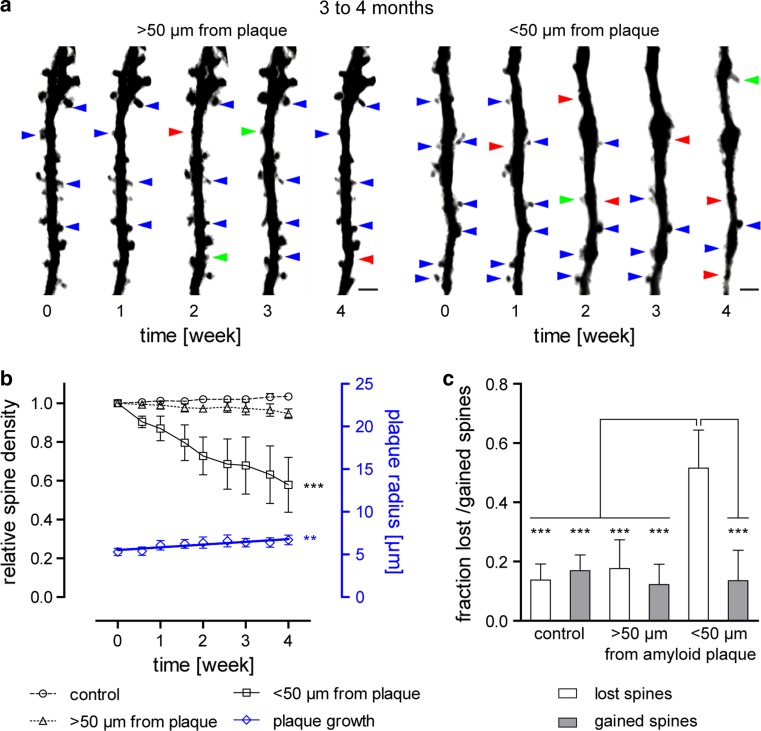
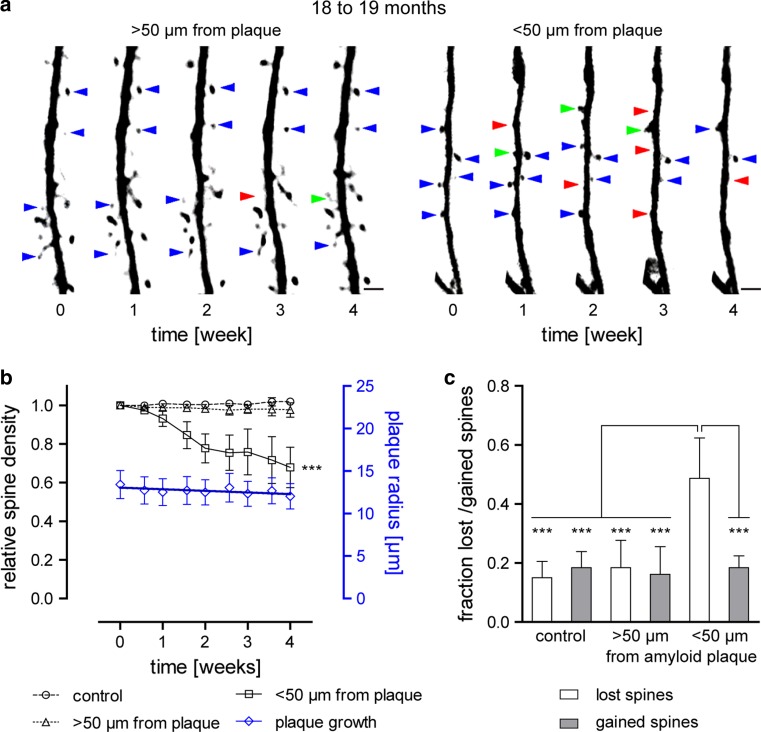
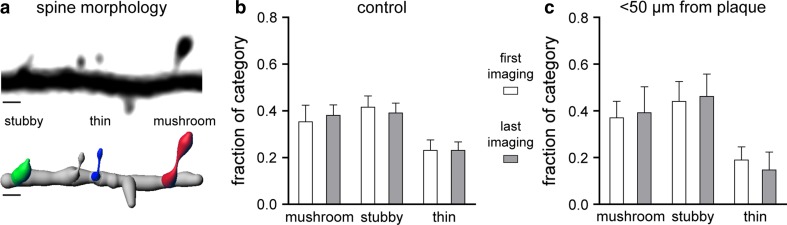
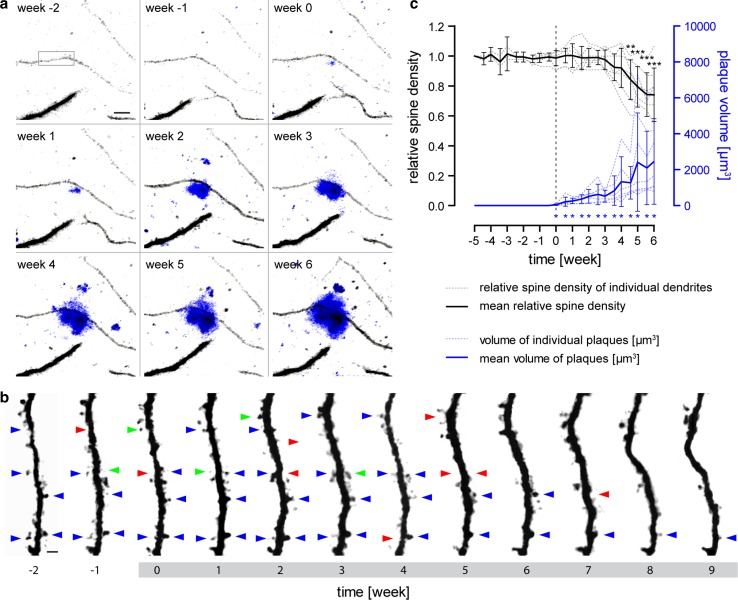
Amyloid-beta plaque deposition represents a major neuropathological hallmark of Alzheimer's disease. While numerous studies have described dendritic spine loss in proximity to plaques, much less is known about the kinetics of these processes. In particular, the question as to whether synapse loss precedes or follows plaque formation remains unanswered. To address this question, and to learn more about the underlying kinetics, we simultaneously imaged amyloid plaque deposition and dendritic spine loss by applying two-photon in vivo microscopy through a cranial window in double transgenic APPPS1 mice. As a result, we first observed that the rate of dendritic spine loss in proximity to plaques is the same in both young and aged animals. However, plaque size only increased significantly in the young cohort, indicating that spine loss persists even many months after initial plaque appearance. Tracking the fate of individual spines revealed that net spine loss is caused by increased spine elimination, with the rate of spine formation remaining constant. Imaging of dendritic spines before and during plaque formation demonstrated that spine loss around plaques commences at least 4 weeks after initial plaque formation. In conclusion, spine loss occurs, shortly but with a significant time delay, after the birth of new plaques, and persists in the vicinity of amyloid plaques over many months. These findings hence give further hope to the possibility that there is a therapeutic window between initial amyloid plaque deposition and the onset of structural damage at spines.


Figures

Fig. 1
Fig. 1
Time series of two-photon in vivo overview fluorescence images showing methoxy-X04 labeled amyloid plaques in blue and YFP-labeled dendrites in grey from mice 3–4 months and 18–19 months of age. Scale bar represents 20 μm
Fig. 2
Fig. 2
Static analysis of spine density and plaque size at 3 and 18 months of age. a Diagram showing the mean spine density of dendrites from control mice and transgenic mice, less and more than 50 μm away from amyloid plaques at 3 months of age. The mean spine density distant from plaques (n = 3 mice, 567 μm dendrite length, n = 278 dendritic spines) is not different from the density in control mice (n = 5 mice, 1,860 μm dendrite length, n = 869 dendritic spines), whereas the mean spine density in vicinity to plaques (n = 4 mice, 919 μm dendrite length, n = 239 dendritic spines) is significantly decreased compared to control mice (p < 0.05) and distant from plaques (p < 0.01, one-way ANOVA with Tukey–Kramer post hoc test). b The mean plaque radius is significantly lower at 3 months (n = 80) compared to 18 months (n = 41) of age (p < 0.0001, t test). c Diagram showing the mean spine density of dendrites from control mice and transgenic mice, less and more than 50 μm away from amyloid plaques at 18 months of age. The mean spine density distant from plaques (n = 5 mice. 1,532 μm dendrite length, n = 705 dendritic spines) is not different from the density in control mice (n = 5 mice, 1,752 μm dendrite length, n = 819 dendritic spines), whereas the mean spine density in vicinity to plaques (n = 4 mice, 611 μm dendrite length, n = 129 dendritic spines) is significantly decreased compared to control mice (p < 0.01) and distant from plaques (p < 0.01, one-way ANOVA with Tukey–Kramer post hoc test). Error bars show SD for a, c, and 95 % CI for b
Fig. 3
Fig. 3
Kinetics of dendritic spines and amyloid plaque size from 3 to 4 months of age. a Representative time series of YFP-labeled dendrites and spines shown as maximum intensity projections, more and less than 50 μm distant from plaques. Blue arrows indicate maintained spines, red arrows lost spines, and green arrows gained spines (only some spines are exemplarily marked). Scale bar represents 2 μm. b Relative spine densities (density normalized to time point 0) are presented by black symbols. Data from control mice (n = 5) are shown as circles, > 50 μm away from plaque (n = 3) are indicated by triangles and <50 μm away from plaques (n = 4) as squares. Error bars show SEM. The decline in spine density in vicinity to plaques is significant (p < 0.001, repeated measures ANOVA with Tukey–Kramer post hoc test). Plaque radius is indicated by blue diamonds. Linear regression revealed a significant increase in size over 4 weeks (n = 80 plaques from seven mice, slope 0.320 ± 0.066 μm week−1, p < 0.01, F test, F = 23.811, DFn = 1, DFd = 7). Error bars indicate 95 % CI. c Diagram of the fraction of lost and gained spines over 4 weeks. Spine elimination is significantly increased for dendrites <50 μm distant to plaques compared to dendrites from control animals (p < 0.001, one-way ANOVA with Tukey–Kramer post hoc test). Spine formation remained constant under all conditions. Error bars indicate SD
Fig. 4
Fig. 4
Kinetics of dendritic spines and amyloid plaque size from 18 to 19 months of age. a Representative time series of YFP-labeled dendrites and spines shown as maximum intensity projections, more and less than 50 μm distant from plaques. Blue arrows indicate maintained spines, red arrows lost spines, and green arrows gained spines (only some spines are exemplarily marked). Scale bar represents 2 μm. b Relative spine densities (density normalized to time point 0) are presented by black symbols. Data from control mice (n = 5) are shown as circles, >50 μm away from plaque (n = 5) are indicated by triangles, and <50 μm away from plaques (n = 4) as squares. Error bars show SEM. The decline in spine density in vicinity to plaques is significant (p < 0.001, repeated measures ANOVA with Tukey–Kramer post hoc test). Plaque radius is indicated by blue diamonds. Linear regression revealed a slight decrease in size over 4 weeks, which is not significant (n = 41 plaques from eight mice, slope −0.189 ± 0.084 μm week−1, p > 0.05, F test, F = 4.992, DFn = 1, DFd = 7). Error bars indicate 95 % CI. c Diagram of the fraction of lost and gained spines over 4 weeks. Spine elimination is significantly increased for dendrites <50 μm distant to plaques compared to dendrites from control animals (p < 0.001, one-way ANOVA with Tukey–Kramer post hoc test). Spine formation remained constant under all conditions. Error bars indicate SD
Fig. 5
Fig. 5
Morphology of dendritic spines from 18 to 19 months of age. a Image showing a YFP labeled dendrite (black) and a 3D reconstruction of the same dendrite below. Reconstruction was done for all spines and for each category of spine morphology; examples are shown (“thin” = blue, “stubby” = green, “mushroom” = red). Scale bar represents 1 μm. The graphs show the fractions of spine morphology categories in control mice b (n = 5 mice, 842 μm dendrite length, n = 361 dendritic spines) and for dendrites <50 μm away from plaques c (n = 4 mice, 611 μm dendrite length, n = 129 dendritic spines). There was no change in the fraction of any category over time. A comparison between the control group and dendrites <50 μm away from plaques within each category also did not reveal any statistically significant differences (Chi-squared test). Error bars indicate 95 % CI
Fig. 6
Fig. 6
Spine density kinetics before and during the formation of amyloid plaques. a Maximum intensity projections of two-photon in vivo images of YFP-labeled dendrites (grey) are shown in a weekly imaging interval. At week 0, a new plaque (blue) appeared in direct vicinity to the dendrite in the center. The black rectangle marks the dendritic segment, which is shown in greater magnification in b. Important to note, the dendrite does not take course directly through the plaque, but the plaque is located above the dendrite (for a 3D view see supplementary figure). Scale bar indicates 10 μm. b Time series of the maximum intensity projected YFP labeled dendrite from a. The grey highlighted time scale indicates the time period when the amyloid plaque is already present. Blue arrows indicate maintained spines, red arrows lost spines, and green arrows gained spines (only some spines are exemplarily marked). Scale bar represents 2 μm. c Quantification of the dendritic spine kinetics are shown in black and plaque growth kinetics in blue. Spine densities were normalized to the spine densities at the first time point. The time point when amyloid appeared was set to 0 and is marked by a dashed line. Individual traces from seven dendrites (n = 2 mice, 444 µm dendrite length, n = 247 dendritic spines) are indicated by dashed lines, whereas the solid line shows mean with 95 % CI. Dendritic spine loss became first significant 4 weeks after plaque appearance (p < 0.01, repeated measures ANOVA with Tukey–Kramer post hoc test). In contrast, the increase in amyloid plaque volume became significant directly with appearance (p < 0.05, Wilcoxon signed-rank test against theoretical value 0 μm3)

References

    1. Alpár A, Ueberham U, Brückner MK, Seeger G, Arendt T, Gärtner U. Different dendrite and dendritic spine alterations in basal and apical arbors in mutant human amyloid precursor protein transgenic mice. Brain Res. 2006;1099:189–198. doi: 10.1016/j.brainres.2006.04.109. - DOI - PubMed
    1. Alvarez VA, Sabatini BL. Anatomical and physiological plasticity of dendritic spines. Annu Rev Neurosci. 2007;30:79–97. doi: 10.1146/annurev.neuro.30.051606.094222. - DOI - PubMed
    1. Arendt T. Synaptic degeneration in Alzheimer’s disease. Acta Neuropathol. 2009;118:167–179. doi: 10.1007/s00401-009-0536-x. - DOI - PubMed
    1. Bhatt DH, Zhang S, Gan W-B. Dendritic spine dynamics. Annu Rev Physiol. 2009;71:261–282. doi: 10.1146/annurev.physiol.010908.163140. - DOI - PubMed
    1. Bittner T, Fuhrmann M, Burgold S, Jung CKE, Volbracht C, Steiner H, Mitteregger G, Kretzschmar HA, Haass C, Herms J. Gamma-secretase inhibition reduces spine density in vivo via an amyloid precursor protein-dependent pathway. J Neurosci Off J Soc Neurosci. 2009;29:10405–10409. doi: 10.1523/JNEUROSCI.2288-09.2009. - DOI - PMC - PubMed

Publication types

Substances