. 2012 Dec;86(23):12912-22.
doi: 10.1128/JVI.02207-12. Epub 2012 Sep 19.

Dynamics of the establishment of systemic Potyvirus infection: independent yet cumulative action of primary infection sites

Affiliations

Dynamics of the establishment of systemic Potyvirus infection: independent yet cumulative action of primary infection sites

Guillaume Lafforgue et al. J Virol. 2012 Dec.

Abstract

In the clinic, farm, or field, for many viruses there is a high prevalence of mixed-genotype infections, indicating that multiple virions have initiated infection and that there can be multiple sites of primary infection within the same host. The dynamic process by which multiple primary infection sites interact with each other and the host is poorly understood, undoubtedly due to its high complexity. In this study, we attempted to unravel the basic interactions underlying this process using a plant RNA virus, as removing the inoculated leaf can instantly and rigorously eliminate all primary infection sites. Effective population size in the inoculated leaf and time of removal of the inoculated leaf were varied in experiments, and it was found that both factors positively influenced if the plant became systemically infected and what proportion of cells in the systemic tissue were infected, as measured by flow cytometry. Fitting of probabilistic models of infection to our data demonstrated that a null model in which the action of each focus is independent of the presence of other foci was better supported than a dependent-action model. The cumulative effect of independently acting foci therefore determined when plants became infected and how many individual cells were infected. There was no evidence for interference between primary infection sites, which is surprising given the planar structure of leaves. By showing that a simple null model is supported, we experimentally confirmed--to our knowledge for the first time--the minimal components that dictate interactions of a conspecific virus population establishing systemic infection.


Figures

Fig 1
Fig 1
Relationship of dose to primary infection foci. On the abscissa is the ln-transformed inverse of the virion dilution, which is equivalent to dose on an arbitrary scale, while on the ordinate is the ln-transformed number of foci (see Materials and Methods). Squares represent the experimental data, with error bars indicating the standard deviations. The continuous line represents a fitted dose-independent-action model, whereas the dotted line represents a dose-dependent-action model (see Materials and Methods). The dose-dependent-action model was better supported (Table 1), indicating that the probability of infection decreases with dose. Note that for the dose-independent action model, altering the probability of infection (p) will only shift the position of the response to the right or left and not change its shape on a logarithmic scale. For the experimental data, at higher doses the increase in the focus number with dose appears to taper off, suggesting that it is mainly the higher doses that deviate from dose-independent model predictions; i.e., the dose-independent-action response could be reasonably fitted to only the low-dose data (ln[dose] < 6) by increasing p and thereby shifting the response to the left, whereas given its fixed shape the model cannot be fitted well to the high-dose data (ln[dose] > 6). This effect might occur because the number of infectious sites in the inoculated leaf becomes saturated at high doses.
Fig 2
Fig 2
Conceptual model of viral egress from the inoculated leaf. We illustrate conceptually our null model of the infection process—independent action (IA). Black dots on the leaf indicate primary infection foci. The gray bell-shaped curves are the PDF for egress from the inoculated leaf over time for individual foci, with time increasing from left to right and a mean μt. The black dot on the curve indicates tΜ, one realization of μt (i.e., drawing a value from the PDF) for each focus. Systemic infection commences at tsys when the first focus generates virions that egress the inoculated leaf. As the number of foci per inoculated leaf increases from 1 (A) to 2 (B) to 4 (C), tsys occurs faster due to the cumulative action of independently acting foci, because as the number of realizations increases, the probability of drawing a shorter time increases. We could also expect the distribution of tsys to become skewed toward low values as the number of primary infection foci increases: the fastest draw determines tsys, and one must therefore draw only slow values to obtain tsys.
Fig 3
Fig 3
Model predictions for viral egress from the inoculated leaf. The relation between effective population size (Ne), the time of removal of the inoculated leaf (tx), and the time when the plant becomes systemically infected (tsys) predicted by our model is given. For all three panels, log-transformed Ne is on the x axis, tx is on the y axis, and the frequency of systemic infection is given on the z axis. If κ < 1 (ADA [A]), tsys decreases slower as Ne increases than for the IA model (κ = 1 [B]). If κ > 1 (SDA [C]), tsys decreases faster as Ne increases than for the IA model, resulting in ADA. Note that for Ne = 1, the distribution of the frequencies is the same in all three panels and equivalent to the distribution of tsys for a single primary infection focus.
Fig 4
Fig 4
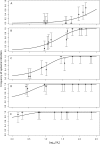
Systemic infection when the inoculated leaf is removed at different times. Plants were rub inoculated, and the inoculated leaf was removed at a given number of hours postinoculation (tx). The relation between log Ne (abscissa) and the frequency of systemic infection (ordinate) was plotted here, when the inoculated leaf was removed after 40 h (A), 44 h (B), 46 h (C), 50 h (D), and 54 h (E). Error bars indicate 95% confidence intervals. The lines represent the fitted independent-action (IA) model (Table 1), which was fitted simultaneously to all the data represented here. The frequency of systemic infection increases with Ne and tx.
Fig 5
Fig 5
Selection on intact protoplasts. In panel A, we show the selection of the intact protoplast population by plotting chlorophyll content (as measured on the FL4 channel) on the abscissa and cellular granularity (as measured by side scatter [SS]) on the ordinate. The population of protoplasts selected for further analysis is indicated by the polygon. In panel B, the discontinuity of protoplast chlorophyll content is illustrated by plotting chlorophyll signal (FL4) on the abscissa and counts on the ordinate; the data can be easily segregated into populations with high and low chlorophyll contents. The GFP signal for protoplasts (abscissa) selected for further analysis (C) and those rejected (D) is divergent in terms of cell counts (ordinate). For selected protoplasts (C), two populations with relatively low heterogeneity can be easily discriminated, with the cutoff determined by the threshold values from GFP-negative controls. For rejected protoplasts the average signal is lower, with most being in the range observed in the negative control, and more heterogeneous (D).
Fig 6
Fig 6
Conceptual model of the proportion of infected cells in the systemic tissue. We illustrate conceptually our null model of the infection process—independent action (IA)—for predicting the number of systemically infected cells. Black dots on the leaf indicate primary infection foci. The bell-shaped curves are the PDF for egress from the inoculated leaf over time for individual foci, with time increasing from left to right. The black dot on the curves indicates tΜ, one realization of μt (i.e., drawing a value from the PDF), for each focus. Each focus produces virions from tΜ until tx, which is marked by the vertical dotted black line, and the sum of positive values obtained by subtracting tΜ from tx determines the total number of virions produced in the inoculated leaf (λ). As the number of foci per inoculated leaf increases from 1 (A) to 2 (B) to 4 (C), the cumulative number of virions released by the inoculated leaf increases. The infection of systemically infected cells then depends on α, the proportion of cells in the systemic tissue that are susceptible to infection, and a parameter representing the probability of infection of a cell and the number of cells available in the systemic tissue (Ψ).
Fig 7
Fig 7
Model predictions for the proportion of infected cells in the systemic tissue. The relation between effective population size (Ne), the time of removal of the inoculated leaf (tx), and the proportion of infected cells in the systemically infected tissue (I) predicted by our model is given for different κ values. For all three panels, log-transformed Ne is on the x axis, tx is on the y axis, and I is on the z axis. When κ < 1 (ADA [A]), I increases slowly for a particular value of Ne and does not completely reach saturation for large Ne values. When κ = 1 (B), I increases rapidly with tx as Ne becomes larger. When κ > 1 (SDA [C]), the increase occurs even more quicklyand the response eventually becomes almost horizontal; the window in which tx values will lead to intermediate I values (i.e., 0 > I > α) becomes very small. Note that similar to the model for tsys, when Ne = 1 the tx versus I relation remains the same irrespective of κ. When Ne = 1, I can only be modulated by α, the proportion of cells which is susceptible to infection, and Ψ, a parameter linking the cumulative time that foci release virions to the number of systemically infected cells (see Materials and Methods).
Fig 8
Fig 8
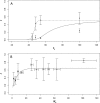
Effects of Ne and tx on the number of infected cells. In panel A, the experimental data fitted the IA model for the effects of the time of the removal of the inoculated leaf (tx, on the abscissa) on the number of infected cells in the systemically infected tissue (I, on the ordinate). The solid triangles and solid line represent the data and model, respectively, for a small Ne (1), while the open circles and dotted line represent a large Ne (100). Error bars represent 95% confidence limits for the data. The IA model was better supported than the DA model, as indicated by AIC-based model selection (Table 4), and accounts satisfactorily for most of the data. The fitted model must account for all the data in the panel, and the only discrepancy between the data and the IA model occurs when Ne is small and tx = 100. In panel B, the effects of Ne (abscissa) on the number of infected cells in the systemically infected tissue (I, on the ordinate) is shown, when the inoculated leaf was removed at the same time (tx = 54 hpi) for all plants. Circles represent the experimental data, with error bars representing 95% confidence intervals, and the line represents the model. To represent the data, Ne values of 1 to 3, 4 to 6, 7 to 9, 10 to 19, 20 to 29, 30 to 39, 40 to 49, 50 to 59, 60 to 69, and >70 were grouped together. The IA model was better supported than the DA model, and fitted-model parameters are similar to those of the other experiment measuring I (in which tx was also varied [Table 2]).

Similar articles

Cited by

References

    1. Ali A, et al. 2006. Analysis of genetic bottlenecks during horizontal transmission of Cucumber mosaic virus. J. Virol. 80:8345–8350 - PMC - PubMed
    1. Bald JG. 1937. The use of numbers of infections for comparing the concentration of plant virus suspensions. I. Dilution experiments with purified suspensions. Ann. Appl. Biol. 24:33–55
    1. Betancourt M, Fereres A, Fraile A, García-Arenal F. 2008. Estimation of the effective number of founders that initiate an infection after aphid transmission of a multipartite plant virus. J. Virol. 82:12416–12421 - PMC - PubMed
    1. Carrasco P, Daròs JA, Agudelo-Romero P, Elena SF. 2007. A real-time RT-PCR assay for quantifying the fitness of Tobacco etch virus in competition experiments. J. Virol. Methods 139:181–188 - PubMed
    1. Carrington JC, Kasschau KD, Mahajan SK, Schaad MC. 1996. Cell-to-cell and long-distance transport of viruses in plants. Plant Cell 8:1669–1681 - PMC - PubMed

Publication types

Substances