. 2012 Dec;53(12):2643-55.
doi: 10.1194/jlr.M030494. Epub 2012 Sep 19.

Intestine-specific expression of Apobec-1 rescues apolipoprotein B RNA editing and alters chylomicron production in Apobec1 -/- mice

Affiliations

Intestine-specific expression of Apobec-1 rescues apolipoprotein B RNA editing and alters chylomicron production in Apobec1 -/- mice

Valerie Blanc et al. J Lipid Res. 2012 Dec.

Abstract

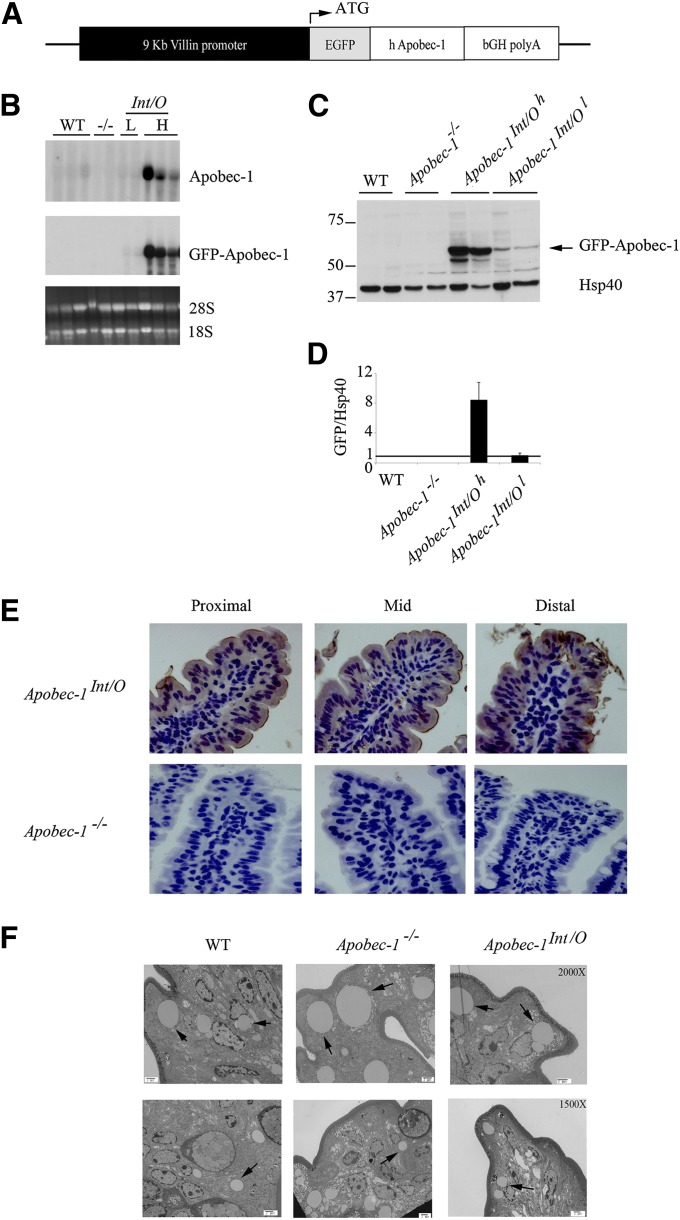
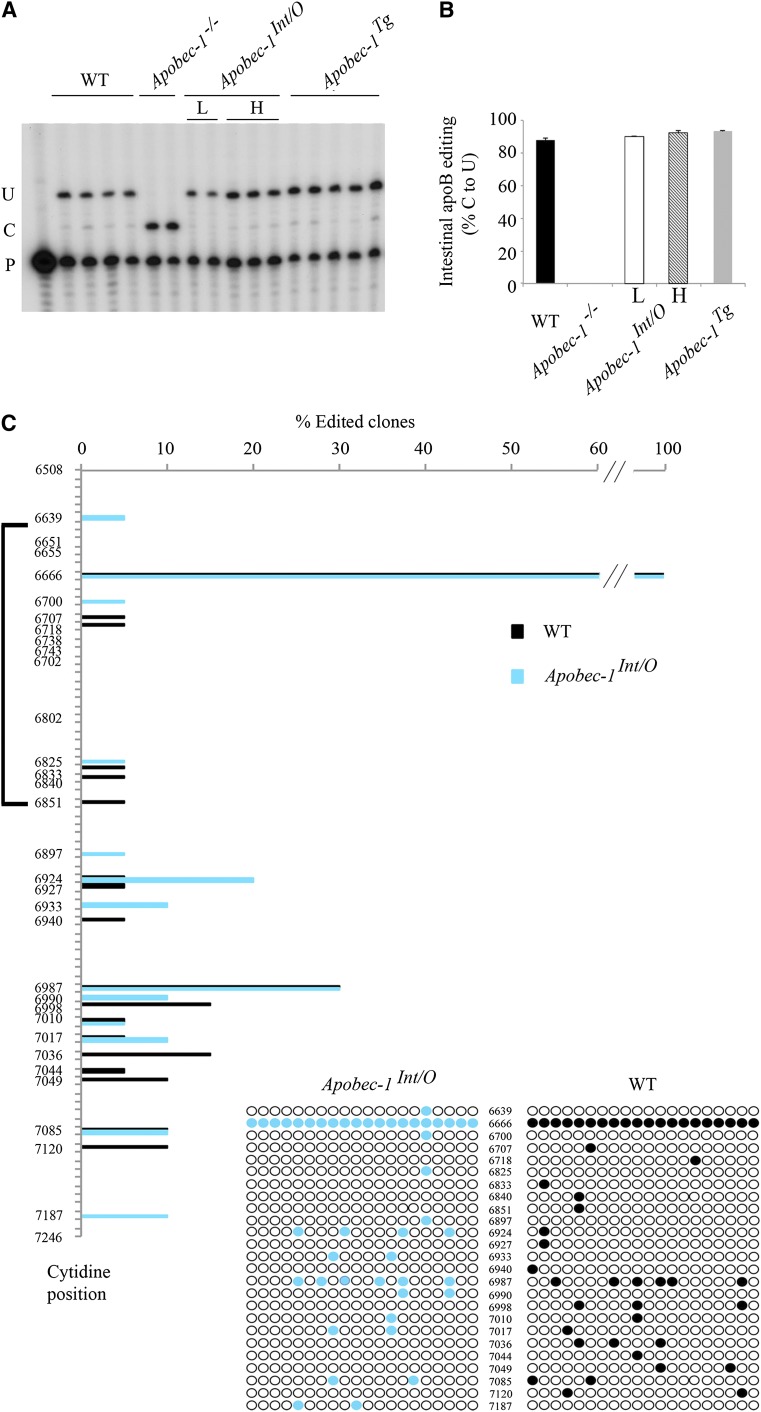
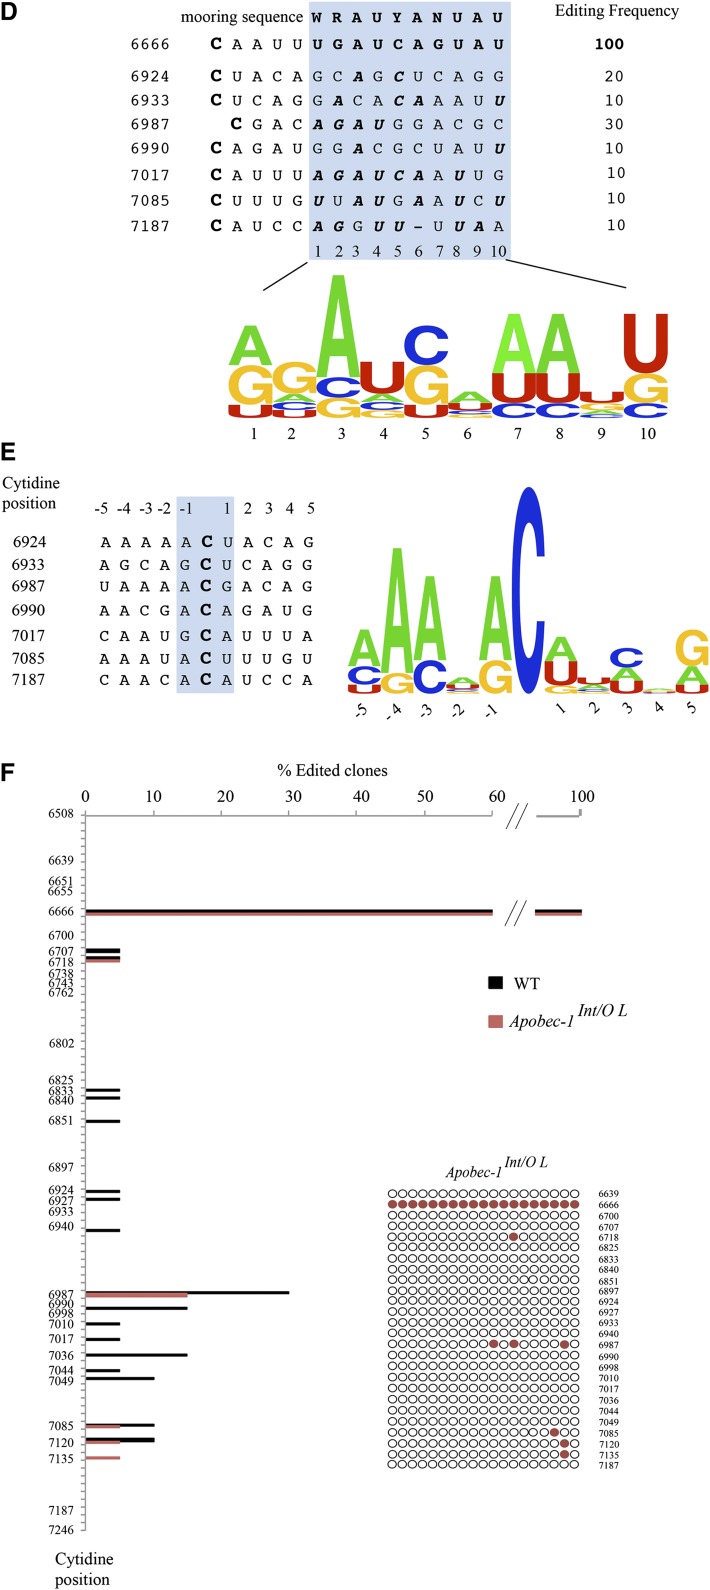
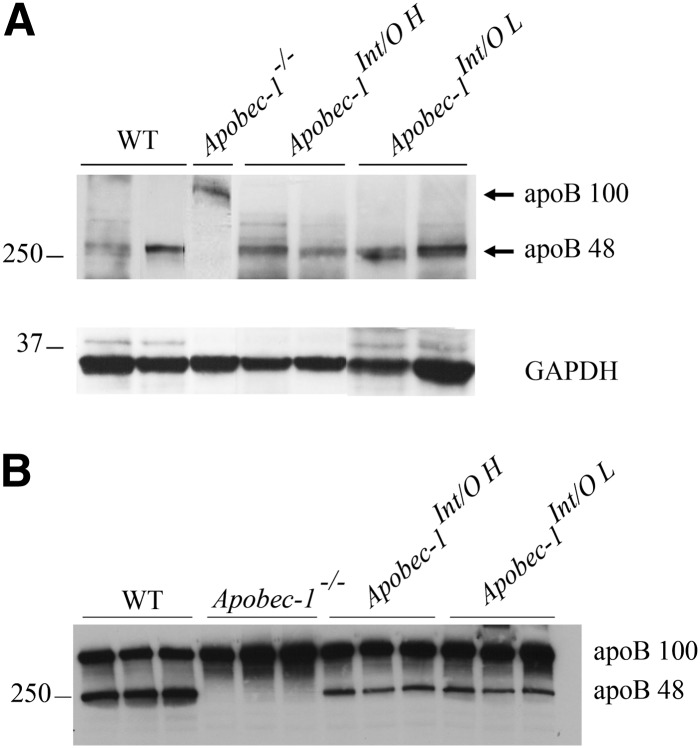
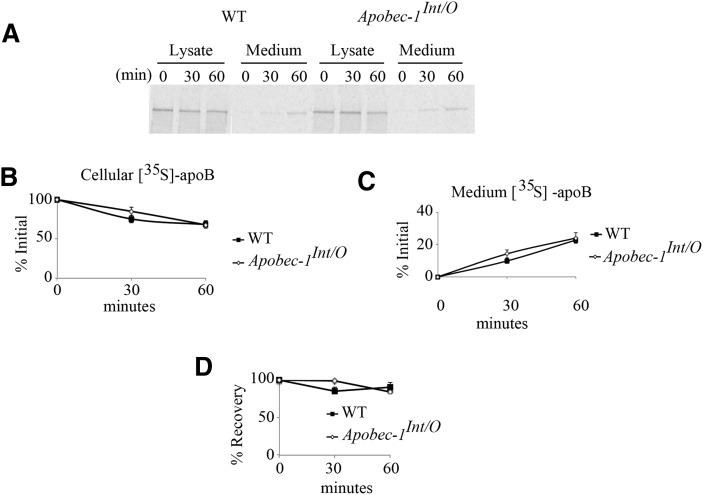
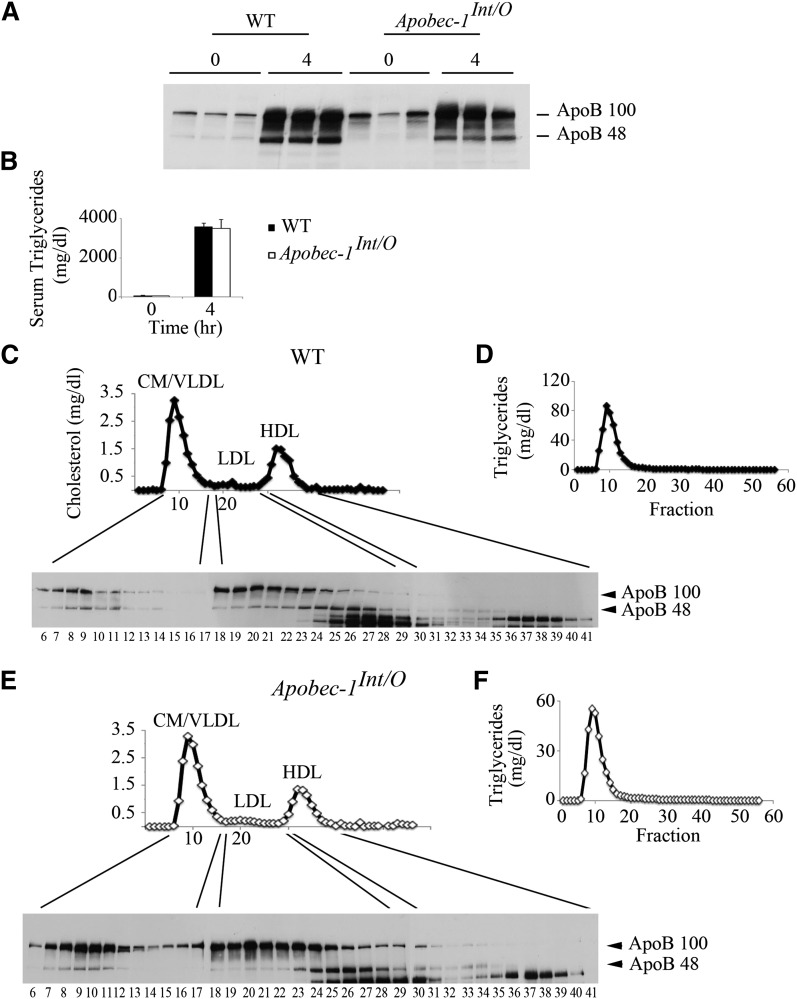
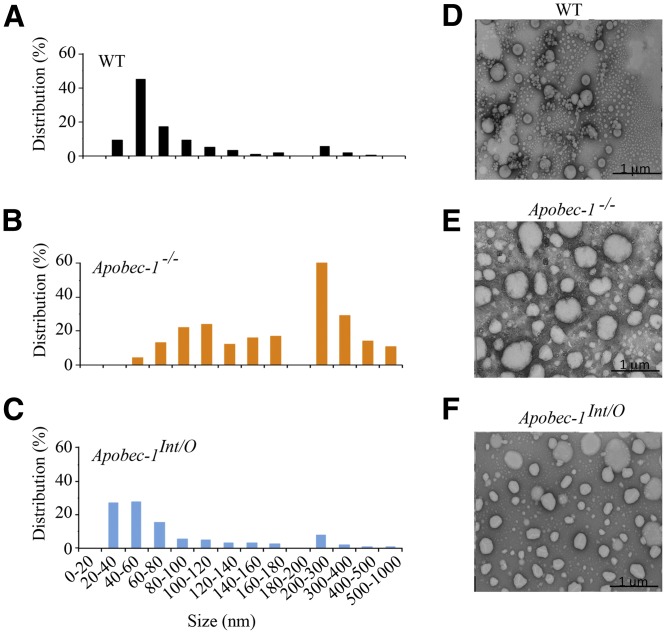
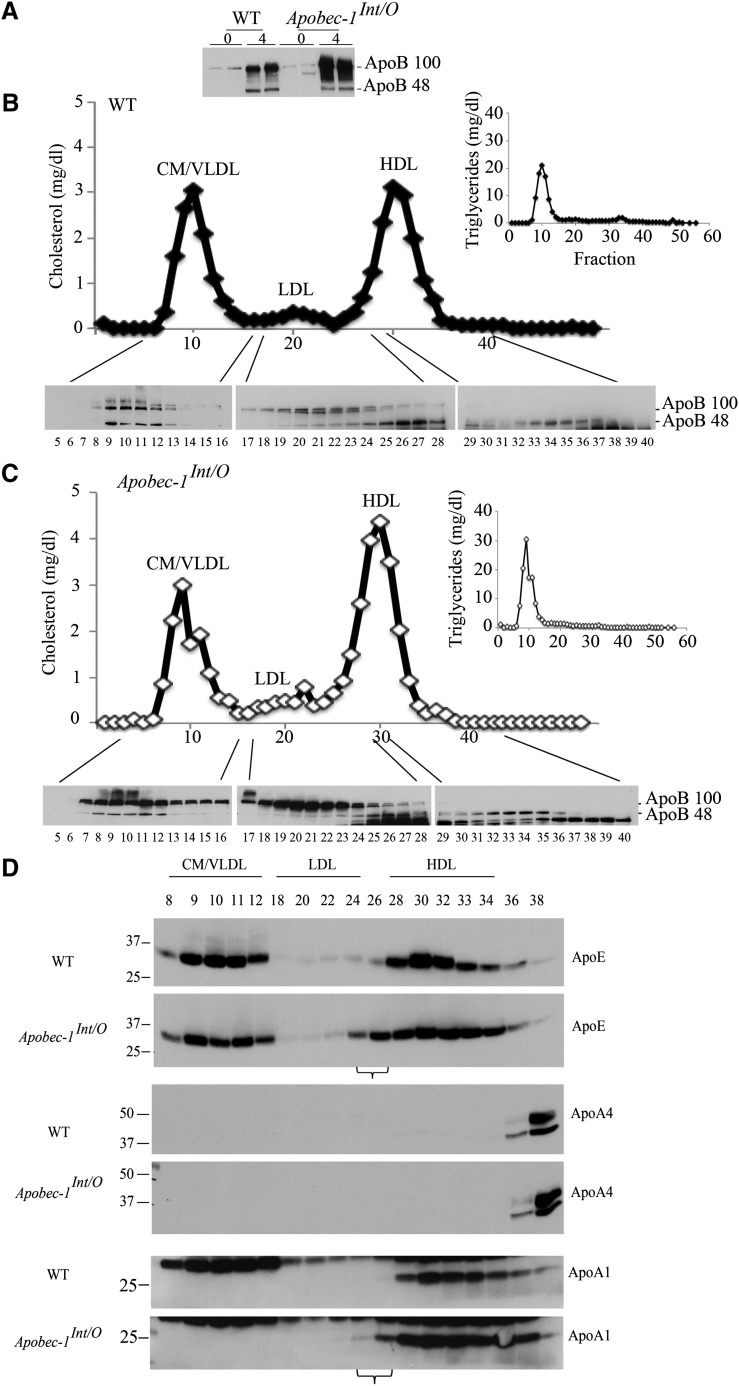
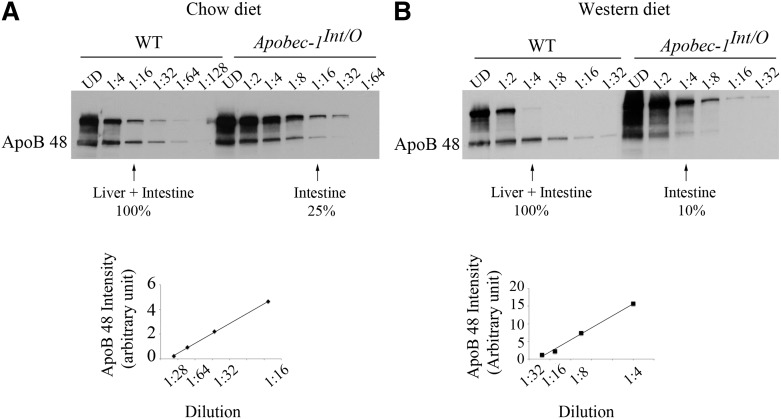
Intestinal apolipoprotein B (apoB) mRNA undergoes C-to-U editing, mediated by the catalytic deaminase apobec-1, which results in translation of apoB48. Apobec1(-/-) mice produce only apoB100 and secrete larger chylomicron particles than those observed in wild-type (WT) mice. Here we show that transgenic rescue of intestinal apobec-1 expression (Apobec1(Int/O)) restores C-to-U RNA editing of apoB mRNA in vivo, including the canonical site at position 6666 and also at approximately 20 other newly identified downstream sites present in WT mice. The small intestine of Apobec1(Int/O) mice produces only apoB48, and the liver produces only apoB100. Serum chylomicron particles were smaller in Apobec1(Int/O) mice compared with those from Apobec1(-/-) mice, and the predominant fraction of serum apoB48 in Apobec1(Int/O) mice migrated in lipoproteins smaller than chylomicrons, even when these mice were fed a high-fat diet. Because apoB48 arises exclusively from the intestine in Apobec1(Int/O) mice and intestinal apoB48 synthesis and secretion rates were comparable to WT mice, we were able to infer the major sites of origin of serum apoB48 in WT mice. Our findings imply that less than 25% of serum apoB48 in WT mice arises from the intestine, with the majority originating from the liver.


Figures

Fig. 1.
Fig. 1.
Generation of intestine-only Apobec-1 (Apobec-1Int/O) transgenic mice. A. Schematic of transgenic construct. Human apobec-1 was cloned downstream of the coding sequence of green fluorescent protein (EGFP) and expressed as a GFP fusion. The expression of the transgene is under control of the Villin promoter (black box). B. Northern blot analysis. Total RNA was extracted from proximal scraped mucosa of individual WT, Apobec-1−/−, Apobec-1Int/O low-expressor (L), and Apobec-1Int/O high-expressor (H) mice was resolved by electrophoresis and hybridized with either a 445-nt 32P-labeled DNA probe recognizing both murine and human apobec-1 or a 445 nt 32P-labeled DNA probe recognizing the GFP coding sequence. C. Western blot analysis of transgene expression. Equal amounts of protein extracted from scraped proximal mucosa processed from individual animals were resolved by SDS-PAGE and probed with anti-GFP antibody and Hsp40 for loading control. D. Histogram representing protein expression of GFP-Apobec-1 relative to Hsp40. The high-expressor line (Apobec-1Int/Oh) shows ∼8-fold higher level of transgene expression compared with the low-expressor (Apobec-1Int/Ol) line. E. Immunohistochemical analysis. Proximal, mid and distal sections of the small intestine from Apobec-1Int/O and Apobec-1−/− mice were stained with anti-GFP antibody. Note that transgene distributes between nucleus and cytoplasm of epithelial cells. F. Electron microscopy of small intestines harvested from chow-fed WT, Apobec-1−/− and Apobec-1Int/O 4 h after lipid gavage. 10-15 pictures were analyzed per mouse using 3 mice per genotype. The arrows indicate lipid droplets. Note that there is no significant difference in the size of lipid droplets between the 3 genotypes.
Fig. 2.
Fig. 2.
Transgenic rescue of apobec-1 in the intestine of Apobec-1−/− mice restores ApoB C-to-U RNA editing. A: Endogenous apoB mRNA editing was determined by primer extension. The relative mobility of the unedited (C) and edited (U) products is indicated on the left. B: Bar graph representation of percentage C-to-U editing for each group as mean ± SE. (n = 3–5). C, D: Hyperediting of apoB mRNA analyzed by DNA sequencing. A 738 bp fragment (6508–7246 nt) of apoB mRNA overlapping the C6666 canonical editing site was amplified by RT-PCR subcloned into pPCR-Script vector and sequenced. Twenty clones per genotype (from two mice per genotype) were analyzed. Targeted cytidines identified in Apobec-1Int/O clones are indicated by blue circles, aligned with the nucleotide position. Edited cytidines identified in WT clones are indicated with black circles, aligned with the nucleotide position. The bracket on the left side of the vertical panel indicates the region of apoB mRNA found by Innerarity and colleagues to be promiscuously edited in hepatic apobec-1 transgenic mice (20). D: Alignment of a 14 nt sequence downstream of C-to-U editing sites with ≥ 10% editing identified in RNA from Apobec-1Int/Oh mice [see (C)]. The sequences were compared with the apoB RNA canonical mooring sequence shown on the top. W, A/U; R, A/G; Y, U/C. The edited C is indicated in bold font at the beginning of each sequence. The nucleotides matching the mooring sequence are indicated in bold italic letters. Below is shown the frequency plot of nucleotides in the 10 nt motif containing matching residue aligned with the consensus mooring sequence (blue box). E: Alignment and frequency plot of nearest neighbor nucleotides flanking each C-to-U RNA editing site. Positions are indicated relative to the targeted cytidine. Frequency plots were created using Weblogo software (Berkeley, CA). F: Hyperediting of intestinal apoB RNA isolated from Apobec-1Int/O low-expressor mice and analyzed by sequencing as in (C). Edited cytidines identified in 20 independent clones are indicated by red circles.
Fig. 2.
Fig. 2.
Transgenic rescue of apobec-1 in the intestine of Apobec-1−/− mice restores ApoB C-to-U RNA editing. A: Endogenous apoB mRNA editing was determined by primer extension. The relative mobility of the unedited (C) and edited (U) products is indicated on the left. B: Bar graph representation of percentage C-to-U editing for each group as mean ± SE. (n = 3–5). C, D: Hyperediting of apoB mRNA analyzed by DNA sequencing. A 738 bp fragment (6508–7246 nt) of apoB mRNA overlapping the C6666 canonical editing site was amplified by RT-PCR subcloned into pPCR-Script vector and sequenced. Twenty clones per genotype (from two mice per genotype) were analyzed. Targeted cytidines identified in Apobec-1Int/O clones are indicated by blue circles, aligned with the nucleotide position. Edited cytidines identified in WT clones are indicated with black circles, aligned with the nucleotide position. The bracket on the left side of the vertical panel indicates the region of apoB mRNA found by Innerarity and colleagues to be promiscuously edited in hepatic apobec-1 transgenic mice (20). D: Alignment of a 14 nt sequence downstream of C-to-U editing sites with ≥ 10% editing identified in RNA from Apobec-1Int/Oh mice [see (C)]. The sequences were compared with the apoB RNA canonical mooring sequence shown on the top. W, A/U; R, A/G; Y, U/C. The edited C is indicated in bold font at the beginning of each sequence. The nucleotides matching the mooring sequence are indicated in bold italic letters. Below is shown the frequency plot of nucleotides in the 10 nt motif containing matching residue aligned with the consensus mooring sequence (blue box). E: Alignment and frequency plot of nearest neighbor nucleotides flanking each C-to-U RNA editing site. Positions are indicated relative to the targeted cytidine. Frequency plots were created using Weblogo software (Berkeley, CA). F: Hyperediting of intestinal apoB RNA isolated from Apobec-1Int/O low-expressor mice and analyzed by sequencing as in (C). Edited cytidines identified in 20 independent clones are indicated by red circles.
Fig. 3.
Fig. 3.
Intestinal and serum apoB48 protein expression is restored in Apobec-1Int/O mice. A: Protein from scraped proximal mucosa was resolved by 4–15% SDS-PAGE and probed with anti-apoB and anti-GAPDH antibody. B: Serum from chow-fed mice was separated by 4–15% SDS-PAGE and analyzed with anti-apoB antibody.
Fig. 4.
Fig. 4.
ApoB48 synthesis and secretion in Apobec-1Int/O and WT enterocytes. Enterocytes from WT and Apobec-1Int/O chow-fed mice were pulse labeled for 30 min and chased for 30–60 min. A–D: Lysates and media were collected at the indicated times. [35S]ApoB isoforms were immunoprecipitated from cell lysates and media, separated by SDS-PAGE, and quantitated by PhosphorImager. [35S]-ApoB48 is expressed as a percentage of the initial label incorporated at the beginning of the chase. Four separate experiments were performed for each genotype using enterocytes isolated from four individual animals. Data are represented as mean ± SE.
Fig. 5.
Fig. 5.
Serum apoB48 is distributed in smaller LDL and HDL-size particles in Apobec-1Int/O mice. Following an overnight fast, chow-fed Apobec-1Int/O and WT mice were administered Pluronic F127 and received an intragastric bolus of lipid. Serum was collected before (time 0) and 4 h after gavage. A: Serum (2 µl) were separated by 4–15% SDS-PAGE and probed with apoB antibody. B: Serum triglyceride levels were evaluated enzymatically at indicated times. Data represent mean ± SE from three WT and six Apobec-1Int/O mice. C, E: Pooled serum from three WT and six Apobec-1Int/O animals collected 4 h after lipid gavage was fractionated by FPLC, and 56 (500 µl) fractions were collected. Aliquots of individual fractions were separated by SDS-PAGE and probed with apoB antibody. This is a representative of two separate experiments. Cholesterol (C, E) and triglycerides (D, F) content was enzymatically determined in individual fractions. The reactive bands migrating faster than apoB48 are nonspecific.
Fig. 6.
Fig. 6.
Electron microscopy of serum chylomicrons. Chylomicrons (density < 1.006) were isolated from pooled serum collected 4 h after Pluronic F127 injection and lipid gavage and submitted for negative staining electron microscopy. The histograms (A–C) representing the size distribution were generated by measuring 400 particles per sample. Representative images from three animals per genotype are shown (D, WT; E, Apobec-1−/−; F, Apobec-1Int/O).
Fig. 7.
Fig. 7.
Serum lipoprotein distribution of apoB48 in Western diet-fed Apobec-1Int/O and WT mice. Animals were fed a Western diet for 12 weeks and overnight fasted mice received Pluronic 127 followed by an intragastric lipid bolus. Animals were euthanized 4 h later. A: Serum was collected and 2 µl was separated by SDS-PAGE and analyzed with apoB antibody. B, C: Pooled serum from five WT and six Apobec-1Int/O mice were fractionated by FPLC, and individual fractions were resolved by SDS-PAGE. Distribution of apoB48 was determined by Western blot using anti-apoB antibody. Cholesterol and triglyceride content were determined enzymatically. Note that HDL-sized particles from Apobec-1Int/O mice are enriched in apoB48 compared with WT controls. D: Individual FPLC fractions were resolved by SDS-PAGE, and lipoprotein distribution of apoE, apoA4, and apoA1 was analyzed by Western blot. Note that small LDL-sized particles are enriched in apoE and apoAI in Apobec-1Int/O mice, as indicated by the horizontal brackets underlining fractions 24 and 26.
Fig. 8.
Fig. 8.
Relative contribution of liver and intestine to serum apoB48. Pooled serum collected 4 h following lipid gavage from chow-fed (A) and Western diet-fed animals (B) were diluted 1:4 to 1:128 (A) and 1:2 to 1:32 in PBS (B). One microliter of diluted serum was resolved by 4–15% SDS-PAGE and probed using anti-apoB antibody. ApoB48 band intensity was quantitated using Kodak/Image Digital Science and the Carestream Molecular Imaging System software. Band intensities from WT apoB48 were used to create a standard curve. ApoB48 band intensity within the WT standard curve was used to evaluate the relative contribution of intestine to apoB48 production. As an example, in (A), the intensity of the band from Apobec-1Int/O serum diluted 1:16 represents 25% of the band intensity from WT serum of the same dilution.

Similar articles

Cited by

References

    1. Chen Z., Davidson N.O.2006. Genetic regulation of intestinal lipid transport and metabolism. In Physiology of the Gastrointestinal Tract. L. R. Johnson, editor. Elsevier Academic Press, Boston, MA. 1711–1734.
    1. Hussain M. M., Rava P., Walsh M., Rana M., Iqbal J. 2012. Multiple functions of microsomal triglyceride transfer protein. Nutr. Metab. (Lond). 9: 14. - PMC - PubMed
    1. Teng B., Burant C. F., Davidson N. O. 1993. Molecular cloning of an apolipoprotein B messenger RNA editing protein. Science. 260: 1816–1819 - PubMed
    1. Mehta A., Kinter M. T., Sherman N. E., Driscoll D. M. 2000. Molecular cloning of apobec-1 complementation factor, a novel RNA-binding protein involved in the editing of apolipoprotein B mRNA. Mol. Cell. Biol. 20: 1846–1854 - PMC - PubMed
    1. Lellek H., Kirsten R., Diehl I., Apostel F., Buck F., Greeve J. 2000. Purification and molecular cloning of a novel essential component of the apolipoprotein B mRNA editing enzyme-complex. J. Biol. Chem. 275: 19848–19856 - PubMed

Publication types

MeSH terms

LinkOut - more resources