. 2013 Feb;30(2):457-68.
doi: 10.1093/molbev/mss227. Epub 2012 Sep 19.

Inference on population histories by approximating infinite alleles diffusion

Affiliations

Inference on population histories by approximating infinite alleles diffusion

Jukka Sirén et al. Mol Biol Evol. 2013 Feb.

Abstract

Reconstruction of the past is an important task of evolutionary biology. It takes place at different points in a hierarchy of molecular variation, including genes, individuals, populations, and species. Statistical inference about population histories has recently received considerable attention, following the development of computational tools to provide tractable approaches to this very challenging problem. Here, we introduce a likelihood-based approach which generalizes a recently developed model for random fluctuations in allele frequencies based on an approximation to the neutral Wright-Fisher diffusion. Our new framework approximates the infinite alleles Wright-Fisher model and uses an implementation with an adaptive Markov chain Monte Carlo algorithm. The method is especially well suited to data sets harboring large population samples and relatively few loci for which other likelihood-based models are currently computationally intractable. Using our model, we reconstruct the global population history of a major human pathogen, Streptococcus pneumoniae. The results illustrate the potential to reach important biological insights to an evolutionary process by a population genetics approach, which can appropriately accommodate very large population samples.


Figures

F<sc>ig</sc>. 1.
Fig. 1.
Correct and estimated branch lengths for the simulated data set. The length of each branch is proportional to the value of corresponding relative time τ parameter. (A) Values used in simulation, (B) posterior expectations from analysis using 7 loci, and (C) 112 loci.
F<sc>ig</sc>. 2.
Fig. 2.
Posterior estimates of the pairwise distances with different number of loci. Box plots of the posterior distributions for sum of distances to the root τ for each pair of populations from the analysis of the simulated data. The number of loci used was 7, 14, 28, 56, and 112. The pair of populations is indicated above each subplot. The box depicts the 25% and 75% quantiles and the whiskers depict the minimum and maximum among posterior samples. The horizontal line depicts the value used in simulating the data.
F<sc>ig</sc>. 3.
Fig. 3.
Posterior estimates of the branch lengths with different number of loci. Box plots of the posterior distributions for the branch lengths τ from the analysis of the simulated data using the correct topology. The number of loci used was 7, 14, 28, 56, and 112. The box depicts the 25% and 75% quantiles and the whiskers depict the minimum and maximum among posterior samples. The lengths of the two branches 6 and 8 connected to the root are summed, because the placement of the root is not identifiable under the infinite alleles model. The horizontal line depicts the value used in simulating the data.
F<sc>ig</sc>. 4.
Fig. 4.
Posterior estimates of the parameter values for the African Streptococcus pneumoniae populations. Box plots of the posterior distributions for the relative time τ, the effective mutation rate m and the product tu. The box depicts the 25% and 75% quantiles and the whiskers depict the minimum and maximum among posterior samples.
F<sc>ig</sc>. 5.
Fig. 5.
Trees with most support from the pair-wise analysis of global Streptococcus pneumoniae populations. Two tree topologies with most support. The percentage above each tree shows the proportion of the posterior samples for which the corresponding had best fit. The branch lengths are averages from the posterior samples.
F<sc>ig</sc>. 6.
Fig. 6.
Phylogenetic network from the pair-wise analysis of global Streptococcus pneumoniae populations. The network was generated in SplitTree4 program using posterior expectations of the branch lengths as the distances.

Similar articles

Cited by

References

    1. Balding DJ, Nichols RA. A method for quantifying differentiation between populations at multi-allelic loci and its implications for investigating identity and paternity. Genetica. 1995;96:3–12. - PubMed
    1. Bryant D, Bouckaert R, Felsenstein J, Rosenberg N, RoyChoudhury A. Inferring species trees directly from biallelic genetic markers: bypassing gene trees in a full coalescent analysis. Mol Biol Evol. 2012;29:1917–1932. - PMC - PubMed
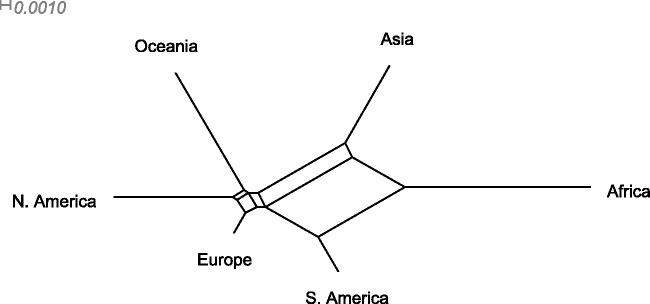
    1. Bryant D, Moulton V. Neighbor-net: an agglomerative method for the construction of phylogenetic networks. Mol Biol Evol. 2004;21:255–265. - PubMed
    1. Cavalli-Sforza L, Edwards A. Phylogenetic analysis: models and estimation procedures. Am J Hum Genet. 1967;19:233–257. - PMC - PubMed
    1. Cornuet JM, Santos F, Beaumont MA, Robert CP, Marin JM, Balding DJ, Guillemaud T, Estoup A. Inferring population history with DIY ABC: a user-friendly approach to approximate Bayesian computation. Bioinformatics. 2008;24:2713–2719. - PMC - PubMed

Publication types