

A paper-based multiplexed transaminase test for low-cost, point-of-care liver function testing
- PMID: 22993296
- PMCID: PMC3624093
- DOI: 10.1126/scitranslmed.3003981
A paper-based multiplexed transaminase test for low-cost, point-of-care liver function testing
Abstract
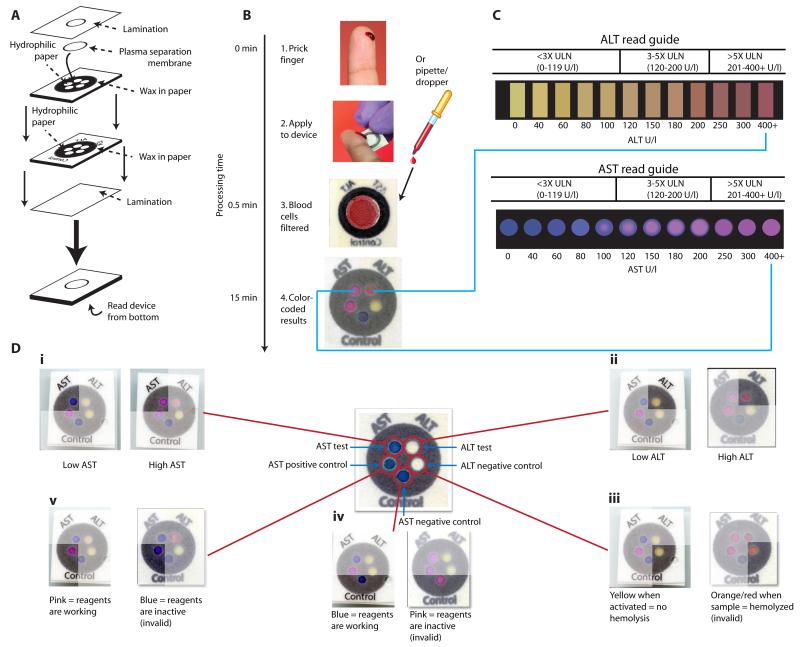
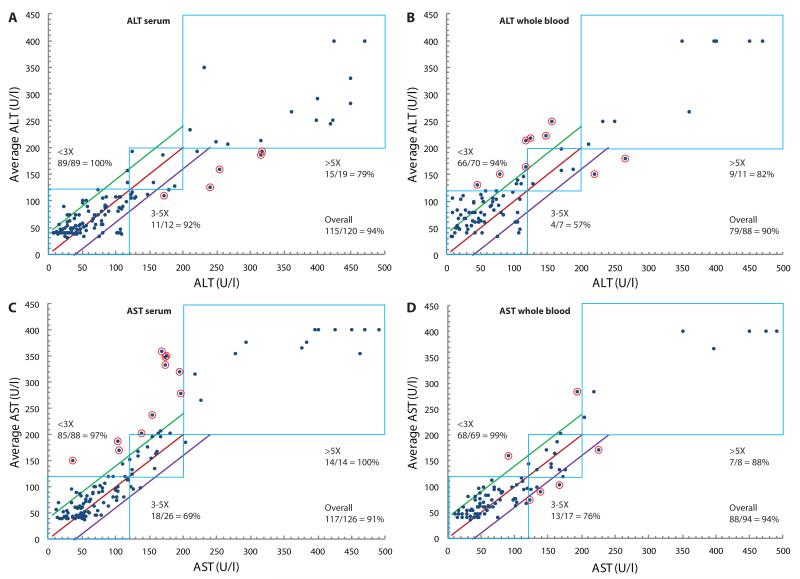
In developed nations, monitoring for drug-induced liver injury through serial measurements of serum transaminases [aspartate aminotransferase (AST) and alanine aminotransferase (ALT)] in at-risk individuals is the standard of care. Despite the need, monitoring for drug-related hepatotoxicity in resource-limited settings is often limited by expense and logistics, even for patients at highest risk. This article describes the development and clinical testing of a paper-based, multiplexed microfluidic assay designed for rapid, semiquantitative measurement of AST and ALT in a fingerstick specimen. Using 223 clinical specimens obtained by venipuncture and 10 fingerstick specimens from healthy volunteers, we have shown that our assay can, in 15 min, provide visual measurements of AST and ALT in whole blood or serum, which allow the user to place those values into one of three readout "bins" [<3× upper limit of normal (ULN), 3 to 5× ULN, and >5× ULN, corresponding to tuberculosis/HIV treatment guidelines] with >90% accuracy. These data suggest that the ultimate point-of-care fingerstick device will have high impact on patient care in low-resource settings.
Figures
Comment in
-
Diagnosis: A new low-cost point-of-care test for liver function has been developed.Nat Rev Gastroenterol Hepatol. 2012 Nov;9(11):618. doi: 10.1038/nrgastro.2012.197. Epub 2012 Oct 9. Nat Rev Gastroenterol Hepatol. 2012. PMID: 23044999 No abstract available.
Similar articles
-
Field evaluation of a prototype paper-based point-of-care fingerstick transaminase test.PLoS One. 2013 Sep 30;8(9):e75616. doi: 10.1371/journal.pone.0075616. eCollection 2013. PLoS One. 2013. PMID: 24098705 Free PMC article.
-
A point-of-care paper-based fingerstick transaminase test: toward low-cost "lab-on-a-chip" technology for the developing world.Clin Gastroenterol Hepatol. 2013 May;11(5):478-82. doi: 10.1016/j.cgh.2013.02.022. Epub 2013 Mar 4. Clin Gastroenterol Hepatol. 2013. PMID: 23466712 Free PMC article.
-
Performance of an Optimized Paper-Based Test for Rapid Visual Measurement of Alanine Aminotransferase (ALT) in Fingerstick and Venipuncture Samples.PLoS One. 2015 May 28;10(5):e0128118. doi: 10.1371/journal.pone.0128118. eCollection 2015. PLoS One. 2015. PMID: 26020244 Free PMC article. Clinical Trial.
-
Review of pyridoxal phosphate and the transaminases in liver disease.Ann Clin Lab Sci. 1986 Mar-Apr;16(2):79-93. Ann Clin Lab Sci. 1986. PMID: 3008634 Review.
-
Specificity of transaminase activities in the prediction of drug-induced hepatotoxicity.J Toxicol Sci. 2020;45(9):515-537. doi: 10.2131/jts.45.515. J Toxicol Sci. 2020. PMID: 32879252 Review.
Cited by
-
A Paper-Based "Pop-up" Electrochemical Device for Analysis of Beta-Hydroxybutyrate.Anal Chem. 2016 Jun 21;88(12):6326-33. doi: 10.1021/acs.analchem.6b00568. Epub 2016 May 31. Anal Chem. 2016. PMID: 27243791 Free PMC article.
-
Next-Generation Microfluidics for Biomedical Research and Healthcare Applications.Biomed Eng Comput Biol. 2023 Nov 27;14:11795972231214387. doi: 10.1177/11795972231214387. eCollection 2023. Biomed Eng Comput Biol. 2023. PMID: 38033395 Free PMC article. Review.
-
Diagnosis: A new low-cost point-of-care test for liver function has been developed.Nat Rev Gastroenterol Hepatol. 2012 Nov;9(11):618. doi: 10.1038/nrgastro.2012.197. Epub 2012 Oct 9. Nat Rev Gastroenterol Hepatol. 2012. PMID: 23044999 No abstract available.
-
A Rapid and Robust Diagnostic for Liver Fibrosis Using a Multichannel Polymer Sensor Array.Adv Mater. 2018 Jul;30(28):e1800634. doi: 10.1002/adma.201800634. Epub 2018 May 24. Adv Mater. 2018. PMID: 29797373 Free PMC article.
-
Bioluminescent sensor proteins for point-of-care therapeutic drug monitoring.Nat Chem Biol. 2014 Jul;10(7):598-603. doi: 10.1038/nchembio.1554. Epub 2014 Jun 8. Nat Chem Biol. 2014. PMID: 24907901
References
-
- Saukkonen JJ, Cohn DL, Jasmer RM, Schenker S, Jereb JA, Nolan CM, Peloquin CA, Gordin FM, Nunes D, Strader DB, Bernardo J, Venkataramanan R, Sterling TR. An official ATS statement: hepatotoxicity of antituberculosis therapy. Am. .J Respir. Crit. Care. Med. 2006;174:935–952. - PubMed
-
- Panel on Antiretroviral Guidelines for Adults and Adolescents . Department of Health and Human Services. Guidelines for the use of antiretroviral agents in HIV-1-infected adults and adolescents; pp. 1–161. Available at http://www.aidsinfo.nih.gov/ContentFiles/AdultandAdolescentGL.pdf.
-
- Tostmann A, Boeree MJ, Aarnoutse RE, de Lange WC, van der Ven AJ, Dekhuijzen R. Antituberculosis drug-induced hepatotoxicity: concise up-to-date review. J. Gastroenterol. Hepatol. 2008;23:192–202. - PubMed
-
- McKoy JM, Bennett CL, Scheetz MH, Differding V, Chandler KL, Scarsi KK, Yarnold PR, Sutton S, Palella F, Johnson S, Obadina E, Raisch DW, Parada JP. Hepatotoxicity associated with long- versus short-course HIV-prophylactic nevirapine use: a systematic review and meta-analysis from the Research on Adverse Drug events And Reports (RADAR) project. Drug Saf. 2009;32:147–158. - PMC - PubMed
-
- Martinez E, Blanco JL, Arnaiz JA, Perez-Cuevas JB, Mocroft A, Cruceta A, Marcos MA, Milinkovic A, Garcia-Viejo MA, Mallolas J, Carne X, Phillips A, Gatell JM. Hepatotoxicity in HIV-1-infected patients receiving nevirapine-containing antiretroviral therapy. AIDS. 2001;15:1261–1268. - PubMed
Publication types
MeSH terms
Substances
Grants and funding
LinkOut - more resources
Full Text Sources
Other Literature Sources
