. 2012 Dec;2(12):1134-49.
doi: 10.1158/2159-8290.CD-12-0120. Epub 2012 Sep 19.

Dual roles of PARP-1 promote cancer growth and progression

Affiliations

Dual roles of PARP-1 promote cancer growth and progression

Matthew J Schiewer et al. Cancer Discov. 2012 Dec.

Abstract

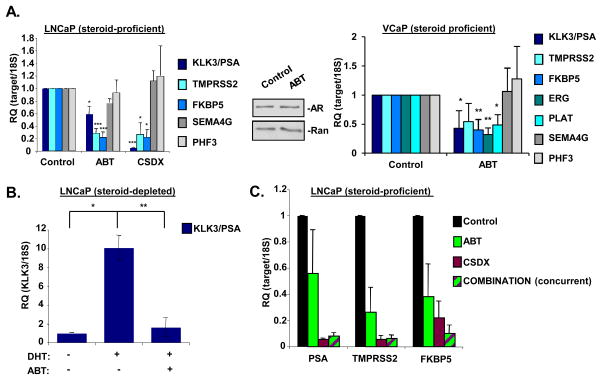
PARP-1 is an abundant nuclear enzyme that modifies substrates by poly(ADP-ribose)-ylation. PARP-1 has well-described functions in DNA damage repair and also functions as a context-specific regulator of transcription factors. With multiple models, data show that PARP-1 elicits protumorigenic effects in androgen receptor (AR)-positive prostate cancer cells, in both the presence and absence of genotoxic insult. Mechanistically, PARP-1 is recruited to sites of AR function, therein promoting AR occupancy and AR function. It was further confirmed in genetically defined systems that PARP-1 supports AR transcriptional function, and that in models of advanced prostate cancer, PARP-1 enzymatic activity is enhanced, further linking PARP-1 to AR activity and disease progression. In vivo analyses show that PARP-1 activity is required for AR function in xenograft tumors, as well as tumor cell growth in vivo and generation and maintenance of castration resistance. Finally, in a novel explant system of primary human tumors, targeting PARP-1 potently suppresses tumor cell proliferation. Collectively, these studies identify novel functions of PARP-1 in promoting disease progression, and ultimately suggest that the dual functions of PARP-1 can be targeted in human prostate cancer to suppress tumor growth and progression to castration resistance.

Significance: These studies introduce a paradigm shift with regard to PARP-1 function in human malignancy, and suggest that the dual functions of PARP-1 in DNA damage repair and transcription factor regulation can be leveraged to suppress pathways critical for promalignant phenotypes in prostate cancer cells by modulation of the DNA damage response and hormone signaling pathways. The combined studies highlight the importance of dual PARP-1 function in malignancy and provide the basis for therapeutic targeting.


Figures

Figure 1
Figure 1
(A) Cell number was assessed 96h after exposure to indicated treatment in indicated cell models. Treatments are: ABT888 (2.5uM), IR (ionizing radiation, 2Gy), ABT888+IR (2.5uM+2Gy), DCTX (1nM docetaxel), and ABT888+DCTX (2.5uM+1nM docetaxel). Vehicle control is set to “100%”. (B) Model systems indicated were treated with vehicle control (solid line) or 2.5uM ABT888 (dashed line), and cell number assessed at indicated time points. Cell number at the zero hour time point is set to “1”. Data reflect averages and standard deviation of at least three independent experiments, each performed with biological triplicates. Statistical significance was determined using Student’s t test. *=p<0.05, **=p<0.01, and ***=p<0.001
Figure 2
Figure 2
(A) Left panel: LNCaP cells were cultured in media containing complete serum, treated for 24h with either ethanol control (0.01%), ABT888 (2.5uM), or Casodex (1uM). Cells were harvested, and qPCR analyses for indicated target genes were performed. Data reflect averages and standard error of at least three independent experiments, each performed with technical triplicates. Results were normalized to 18S and control is set to “1”. Middle panel: LNCaP cells were cultured, treated, and harvested as in A, then lysed, and total protein was separated by SDS-PAGE, transferred to PVDF, and immunoblotted for indicated proteins. Representative image of at least three independent experiments is shown. Right panel: Same as left panel, except cell model is VCaP. (B) LNCaP cells were steroid deprived for 72h, then either pretreated for 30m with vehicle or ABT888 (2.5uM), stimulated with DHT (1nM, 24h) or ethanol control. Cells were harvested and qPCR analyses for KLK3/PSA were performed. Data reflect averages and standard error of at least three independent experiments, each performed with technical triplicates. Results were normalized to 18S and control is set to “1”. (C) LNCaP were cultured in media containing complete serum, treated for 24h with either ethanol control (0.01%), ABT888 (2.5uM), Casodex (1uM) or a combination of ABT888 (1.75uM) and Casodex (0.5uM). Cells were harvested, and qPCR analyses for indicated target genes were performed. Data reflect averages and standard error of at least three independent experiments, each performed with technical triplicates. Results normalized to 18S and control is set to “1”. Statistical significance was determined using Student’s t test. *=p<0.05, **=p<0.01, and ***=p<0.001
Figure 3
Figure 3
(A) LNCaP cells were steroid deprived for 72h, then either pretreated for 30 min with vehicle or ABT888 (2.5uM), stimulated with DHT (1nM, 1h) or ethanol control. Cells were then harvested, lysed, and differentially centrifuged as described in the material and methods section, resulting in a soluble fraction (GAPDH serves as control) or a chromatin-tethered fraction (histone H4 serves as control). Immunoblots were performed for the indicated proteins. A representative image of at least three independent experiments is shown. (B, C, D, and E) LNCaP cells were steroid-deprived for 72h, pretreated for 30m with vehicle or ABT888 (2.5uM), and then stimulated with DHT (10nM, 1h) or ethanol control. Cells were fixed, lysed, and chromatin immunoprecipitation (ChIP) for AR and PARP-1 (B), histone H1 (C), di-methylated lysine 4 of histone H3 (D), tri-methylated lysine 4 of histone H3 (E), or GATA2 (F) was performed. DNA was purified from immunoprecipitates (IPs) and utilized in qPCR reactions for indicated genomic loci. Data is representative of at least three independent experiments, each performed with technical triplicates, and depicted as the averages of immunoprecipitated signals to input signals and standard error. Statistical significance was determined using Student’s t test. *=p<0.05, **=p<0.01, and ***=p<0.001. (G). LNCaP treated as in A. MNase protection assays were performed as described in the Materials and Methods section, from which DNA was purified and utilized in qPCR reactions for amplicons spanning 400bp on either side of the transcriptional start site (TSS) of KLK3/PSA. Data are representative of at least three independent experiments performed in technical triplicate, depicted as the averages of MNase sensitive:protected DNA and standard deviation. Grey box indicates amplicons that are statistically significant between DHT treated samples, and ABT pretreated->DHT treated samples by Student’s t test.
Figure 4
Figure 4
(A) Indicated model systems were cultured in media containing complete serum, harvested, lysed, and total protein was separated by SDS-PAGE, transferred to PVDF, and immunoblotted for indicated proteins. Representative image of at least three independent experiments is shown. (B) PAR ELISA was performed on whole cell lysates of indicated model systems. Data reflect averages and standard deviation of at least three independent experiments, each performed with technical and biological triplicates. (C) Upper panel: indicated model systems were steroid deprived for 72h, then either treated for 30 min with vehicle or ABT888 (2.5uM). Cells were harvested and qPCR analyses were performed for indicated target genes. Data reflect averages and standard error of at least three independent experiments, each performed with biological triplicates. Results were normalized to 18S and control is set to “1”. Lower panel: indicated model systems were treated as above, then harvested, lysed, and total protein was separated by SDS-PAGE, transferred to PVDF, and immunoblotted for indicated proteins. Representative image of at least three independent experiments is shown. (D) C4-2 cells were steroid deprived for 72h, then treated for 30m with vehicle or ABT888 (2.5uM). Cells were fixed, lysed, and ChIP for AR and PARP-1 was performed. DNA was isolated from IPs and utilized in qPCR reactions for indicated genomic loci. Data are representative of at least three independent experiments, each performed with technical triplicates, and depicted as the average of immunoprecipitated signal to input signal and standard error. Statistical significance was determined using Student’s t test. *=p<0.05, **=p<0.01, and ***=p<0.001.
Figure 5
Figure 5
(A) Left: Indicated MEFs were transfected as described in Material and Methods. Cells were then stimulated for approximately 36 hours with 1nM DHT or ethanol control and relative luciferase activity determined. Normalized AR activity in the absence of ligand in the wild type MEFs was set to “1”. Data shown reflects the mean of at least nine independent biological replicates ±SE. Middle: PARP-1−/− MEFs were transfected as above, with the addition of either wild type PARP-1 or a PARP-1 catalytic domain point mutant allele, then treated, processed, harvested, and analyzed as above. *=p<0.05, **=p<0.01, and ***=p<0.001 Right: Parp-1 −/− MEFs were transfected as before, except cells were harvested, lysed, and total protein was separated by SDS-PAGE, transferred to PVDF, and immunoblotted for indicated proteins. (B) Upper panel: Schematic: VCaP xenografts were established for 4 weeks prior to treatment, at which time the mice received a single dose of either Casodex or Olaparib (100mg/kg), tumors were harvested 4 hours later and qPCR analyses were performed for indicated target genes. Data reflect average and standard deviation of at least three independent xenograft tumors, each performed with technical triplicates. Results were normalized to β-actin and control is set to “1”. (lower panel). (C) Tumors were established as in B, except mice were treated with ABT888 (100mg/kg twice daily). 72h later, tumors were harvested and qPCR analyses were performed for indicated target genes. Data reflect average and standard deviation of at least three independent experiments, each performed with technical triplicates. Results were normalized to 18S and control is set to “1”. (D) Upper panel: VCaP xenograft tumors were established as in B and C. Treatment was initiated when tumors reached 150mm3, and consisted of: control, castration alone (Cx), ABT888 (100mg/kg twice daily)(PARPi), and castration + ABT888 (Cx+PARPi.) Tumor volumes were assessed three times each week. The cumulative incidence plot depicts the percent of tumors in each treatment group that have doubled in volume, as a function of time. Each treatment group is significantly different than the control group. The combined treatment group is significantly different than the individual treatment groups as determined by with log-rank (Mantel-Cox) analysis. Lower panel: Median time elapsed before tumor volume doubled for each treatment group. (E) Upper panel: C4-2 xenografts were established as in B. Treatment was initiated when tumors reached 150mm3, and consisted of: castration alone (Cx) as control, and castration + ABT888 (Cx+PARPi). Tumor volumes were assessed daily until animals were sacrificed. Lower panel: tumors from upper panel were excised, homogenized in Trizol, cDNA was generated, and qPCR for the indicated mRNA was performed. Data are presented as mean ± SD of at least three xenografts from each treatment group. Statistical significance was determined using Student’s t test. *=p<0.05, **=p<0.01, and ***=p<0.001.
Figure 6
Figure 6
(A) Upper panel: Schematic of explant assay is depicted as described in the Materials and Methods sections. Lower panel: Representative images of explant tissues that were treated with either control or 2.5uM ABT888, then were formalin fixed and paraffin embedded. Tissue from these paraffin blocks was cut with a microtome and placed on microscope slides. Slides were then utilized to determine relative levels of PAR in these explant tissues by immunohistochemistry using standard techniques. (B) Same as in A, but tissue slides were either stained with hematoxylin & eosin (top) or stained for Ki67 via immunohistochemistry using standard techniques. (C) Quantification of Ki-67 (as a percent of tumor cells that are nuclear positive) as depicted in B from three explants harvested at indicated time points treated with either control or 2.5uM ABT888. Data are presented as mean ± SD of three explant assays from three distinct prostatectomy specimens. (D) Explants were performed as in A, tissue was homogenized in Trizol, cDNA was generated, and qPCR for the indicated mRNA was performed. Data are presented as mean ± SD of at least three distinct explant tissue per treatment group. Statistical significance was determined using Student’s t test. ***=p<0.001.

Similar articles

Cited by

References

    1. D’Amours D, Desnoyers S, D’Silva I, Poirier GG. Poly(ADP-ribosyl)ation reactions in the regulation of nuclear functions. Biochem J. 1999;342 ( Pt 2):249–268. - PMC - PubMed
    1. Krishnakumar R, Kraus WL. The PARP side of the nucleus: molecular actions, physiological outcomes, and clinical targets. Mol Cell. 39:8–24. - PMC - PubMed
    1. Rouleau M, Patel A, Hendzel MJ, Kaufmann SH, Poirier GG. PARP inhibition: PARP1 and beyond. Nat Rev Cancer. 10:293–301. - PMC - PubMed
    1. Juarez-Salinas H, Sims JL, Jacobson MK. Poly(ADP-ribose) levels in carcinogen-treated cells. Nature. 1979;282:740–741. - PubMed
    1. Benjamin RC, Gill DM. ADP-ribosylation in mammalian cell ghosts. Dependence of poly(ADP-ribose) synthesis on strand breakage in DNA. J Biol Chem. 1980;255:10493–10501. - PubMed

Publication types

MeSH terms