Loss of retinoschisin (RS1) cell surface protein in maturing mouse rod photoreceptors elevates the luminance threshold for light-driven translocation of transducin but not arrestin
- PMID: 22993419
- PMCID: PMC3752084
- DOI: 10.1523/JNEUROSCI.1913-12.2012
Loss of retinoschisin (RS1) cell surface protein in maturing mouse rod photoreceptors elevates the luminance threshold for light-driven translocation of transducin but not arrestin
Abstract
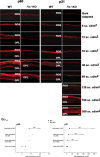
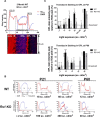
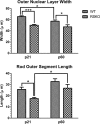
Loss of retinoschisin (RS1) in Rs1 knock-out (Rs1-KO) retina produces a post-photoreceptor phenotype similar to X-linked retinoschisis in young males. However, Rs1 is expressed strongly in photoreceptors, and Rs1-KO mice have early reduction in the electroretinogram a-wave. We examined light-activated transducin and arrestin translocation in young Rs1-KO mice as a marker for functional abnormalities in maturing rod photoreceptors. We found a progressive reduction in luminance threshold for transducin translocation in wild-type (WT) retinas between postnatal days P18 and P60. At P21, the threshold in Rs1-KO retinas was 10-fold higher than WT, but it decreased to <2.5-fold higher by P60. Light-activated arrestin translocation and re-translocation of transducin in the dark were not affected. Rs1-KO rod outer segment (ROS) length was significantly shorter than WT at P21 but was comparable with WT at P60. These findings suggested a delay in the structural and functional maturation of Rs1-KO ROS. Consistent with this, transcription factors CRX and NRL, which are fundamental to maturation of rod protein expression, were reduced in ROS of Rs1-KO mice at P21 but not at P60. Expression of transducin was 15-30% lower in P21 Rs1-KO ROS and transducin GTPase hydrolysis was nearly twofold faster, reflecting a 1.7- to 2.5-fold increase in RGS9 (regulator of G-protein signaling) level. Transduction protein expression and activity levels were similar to WT at P60. Transducin translocation threshold elevation indicates photoreceptor functional abnormalities in young Rs1-KO mice. Rapid reduction in threshold coupled with age-related changes in transduction protein levels and transcription factor expression are consistent with delayed maturation of Rs1-KO photoreceptors.
Figures


Similar articles
-
Photoreceptor pathology in the X-linked retinoschisis (XLRS) mouse results in delayed rod maturation and impaired light driven transducin translocation.Adv Exp Med Biol. 2014;801:559-66. doi: 10.1007/978-1-4614-3209-8_71. Adv Exp Med Biol. 2014. PMID: 24664744 Free PMC article.
-
Synaptic pathology in retinoschisis knockout (Rs1-/y) mouse retina and modification by rAAV-Rs1 gene delivery.Invest Ophthalmol Vis Sci. 2008 Aug;49(8):3677-86. doi: 10.1167/iovs.07-1071. Invest Ophthalmol Vis Sci. 2008. PMID: 18660429 Free PMC article.
-
The translocation of signaling molecules in dark adapting mammalian rod photoreceptor cells is dependent on the cytoskeleton.Cell Motil Cytoskeleton. 2008 Oct;65(10):785-800. doi: 10.1002/cm.20300. Cell Motil Cytoskeleton. 2008. PMID: 18623243
-
Light-dependent compartmentalization of transducin in rod photoreceptors.Mol Neurobiol. 2008 Feb;37(1):44-51. doi: 10.1007/s12035-008-8015-2. Epub 2008 Apr 19. Mol Neurobiol. 2008. PMID: 18425604 Review.
-
Of men and mice: Human X-linked retinoschisis and fidelity in mouse modeling.Prog Retin Eye Res. 2022 Mar;87:100999. doi: 10.1016/j.preteyeres.2021.100999. Epub 2021 Aug 11. Prog Retin Eye Res. 2022. PMID: 34390869 Review.
Cited by
-
Cone-rod homeobox CRX controls presynaptic active zone formation in photoreceptors of mammalian retina.Hum Mol Genet. 2018 Oct 15;27(20):3555-3567. doi: 10.1093/hmg/ddy272. Hum Mol Genet. 2018. PMID: 30084954 Free PMC article.
-
Rearing Light Intensity Affects Inner Retinal Pathology in a Mouse Model of X-Linked Retinoschisis but Does Not Alter Gene Therapy Outcome.Invest Ophthalmol Vis Sci. 2017 Mar 1;58(3):1656-1664. doi: 10.1167/iovs.16-21016. Invest Ophthalmol Vis Sci. 2017. PMID: 28297725 Free PMC article.
-
Photoreceptor pathology in the X-linked retinoschisis (XLRS) mouse results in delayed rod maturation and impaired light driven transducin translocation.Adv Exp Med Biol. 2014;801:559-66. doi: 10.1007/978-1-4614-3209-8_71. Adv Exp Med Biol. 2014. PMID: 24664744 Free PMC article.
-
Genetic Rescue of X-Linked Retinoschisis Mouse (Rs1-/y) Retina Induces Quiescence of the Retinal Microglial Inflammatory State Following AAV8-RS1 Gene Transfer and Identifies Gene Networks Underlying Retinal Recovery.Hum Gene Ther. 2021 Jul;32(13-14):667-681. doi: 10.1089/hum.2020.213. Epub 2020 Dec 14. Hum Gene Ther. 2021. PMID: 33019822 Free PMC article.
-
AAV-Mediated Clarin-1 Expression in the Mouse Retina: Implications for USH3A Gene Therapy.PLoS One. 2016 Feb 16;11(2):e0148874. doi: 10.1371/journal.pone.0148874. eCollection 2016. PLoS One. 2016. PMID: 26881841 Free PMC article.
References
-
- Alpern M, Krantz DH. Visual pigment kinetics in abnormalities of the uvea-retinal epithelium interface in man. Invest Ophthalmol Vis Sci. 1981;20:183–203. - PubMed
-
- Breton ME, Schueller AW, Lamb TD, Pugh EN., Jr Analysis of ERG a-wave amplification and kinetics in terms of the G-protein cascade of phototransduction. Invest Ophthalmol Vis Sci. 1994;35:295–309. - PubMed
-
- Burns ME, Arshavsky VY. Beyond counting photons: trials and trends in vertebrate visual transduction. Neuron. 2005;48:387–401. - PubMed
-
- Calvert PD, Govardovskii VI, Krasnoperova N, Anderson RE, Lem J, Makino CL. Membrane protein diffusion sets the speed of rod phototransduction. Nature. 2001;411:90–94. - PubMed
Publication types
MeSH terms
Substances
Grants and funding
LinkOut - more resources
Full Text Sources
Molecular Biology Databases
Research Materials
