. 2012 Sep 19;32(38):13085-99.
doi: 10.1523/JNEUROSCI.1262-12.2012.

A role for silent synapses in the development of the pathway from layer 2/3 to 5 pyramidal cells in the neocortex

Affiliations

A role for silent synapses in the development of the pathway from layer 2/3 to 5 pyramidal cells in the neocortex

Paul G Anastasiades et al. J Neurosci. .

Abstract

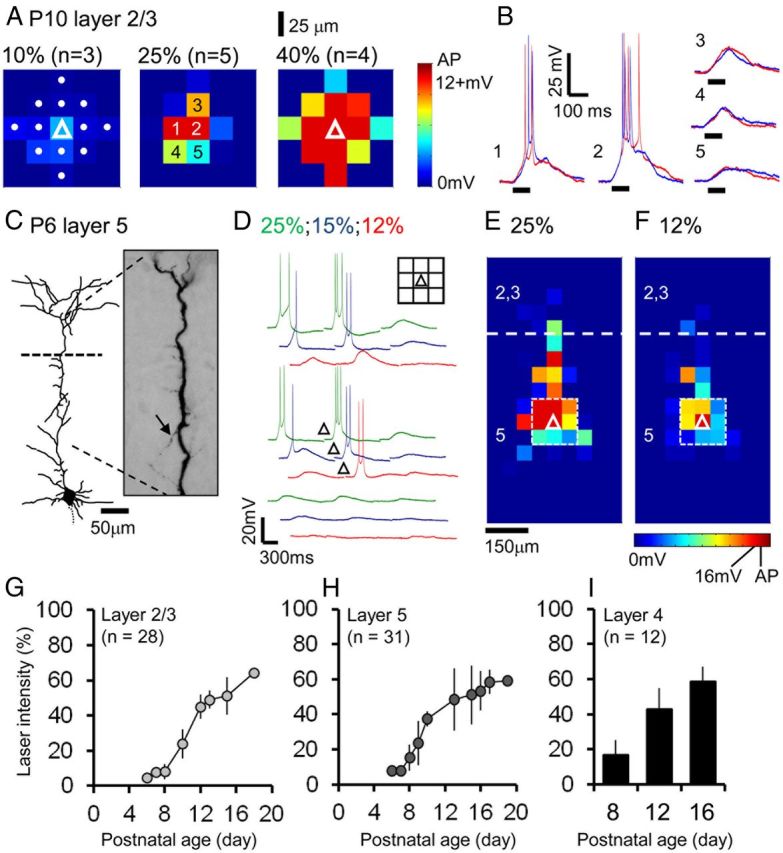
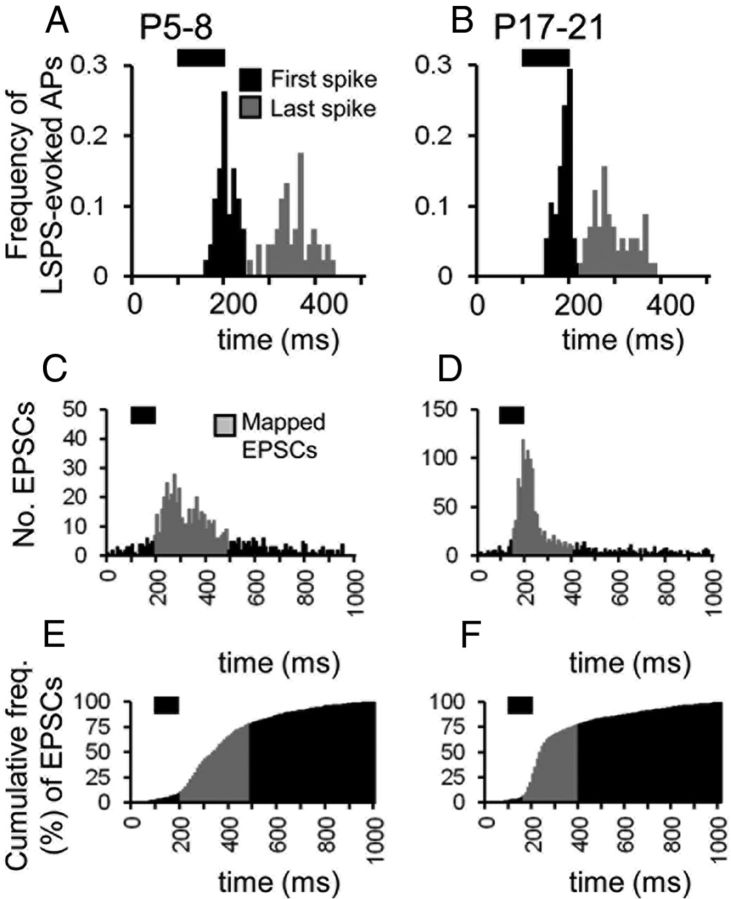
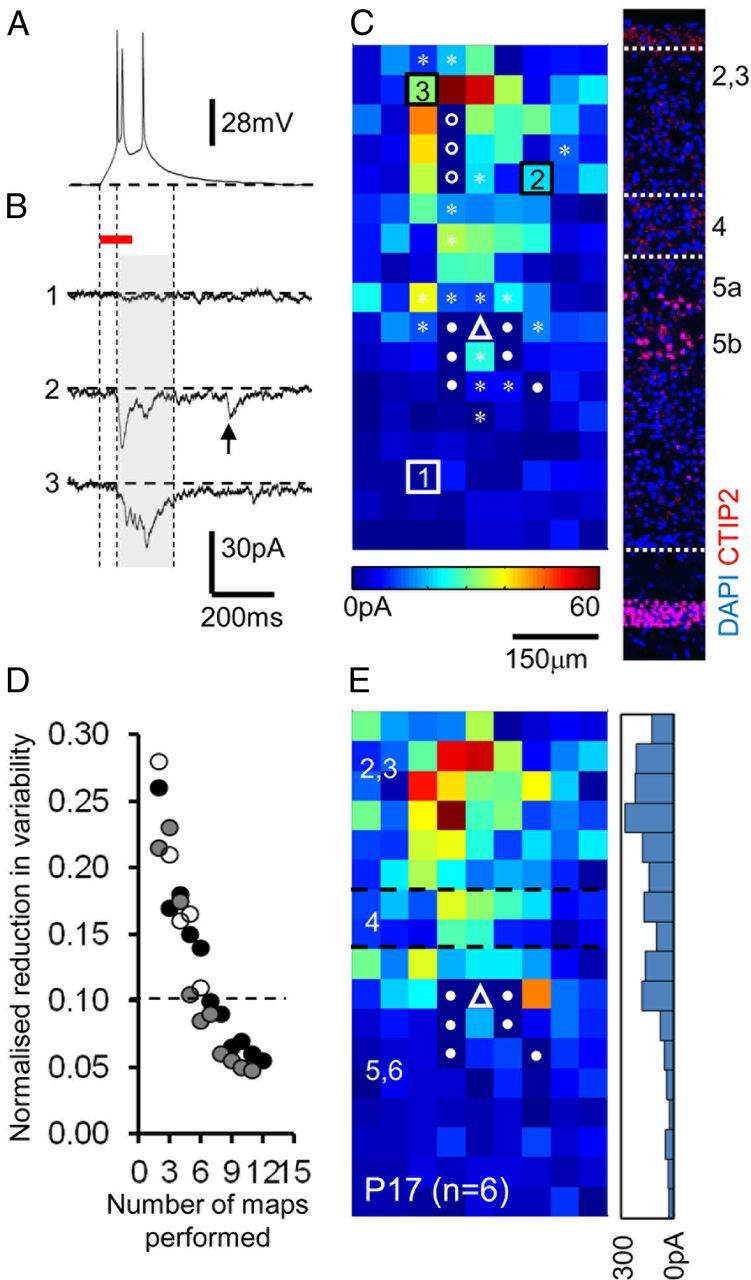
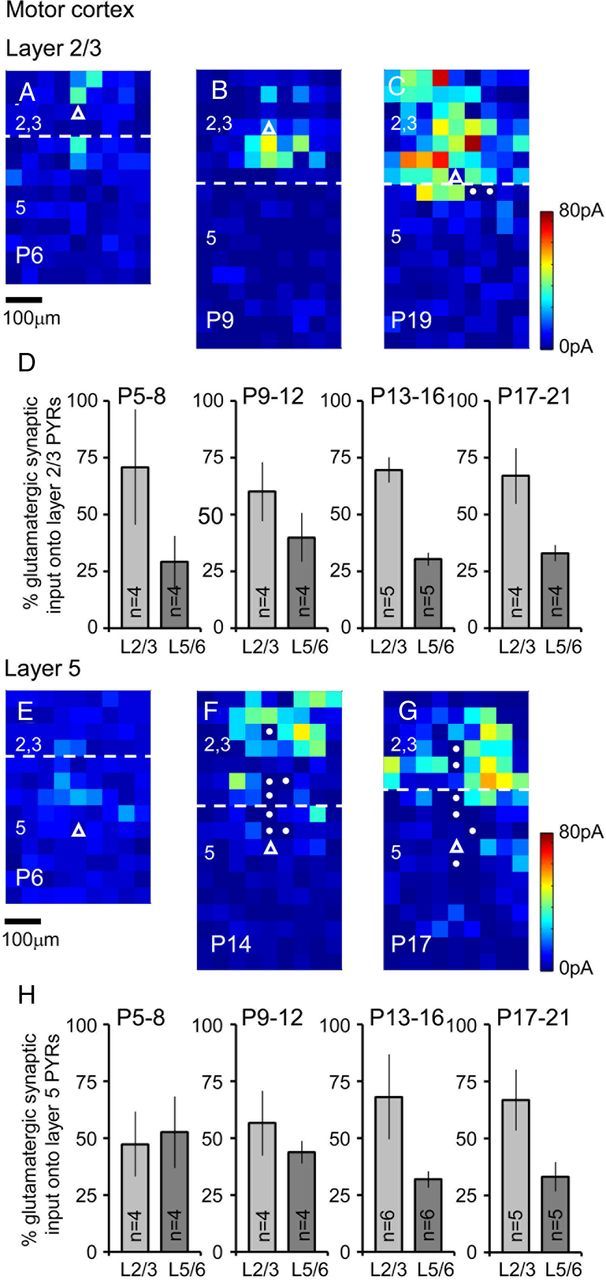
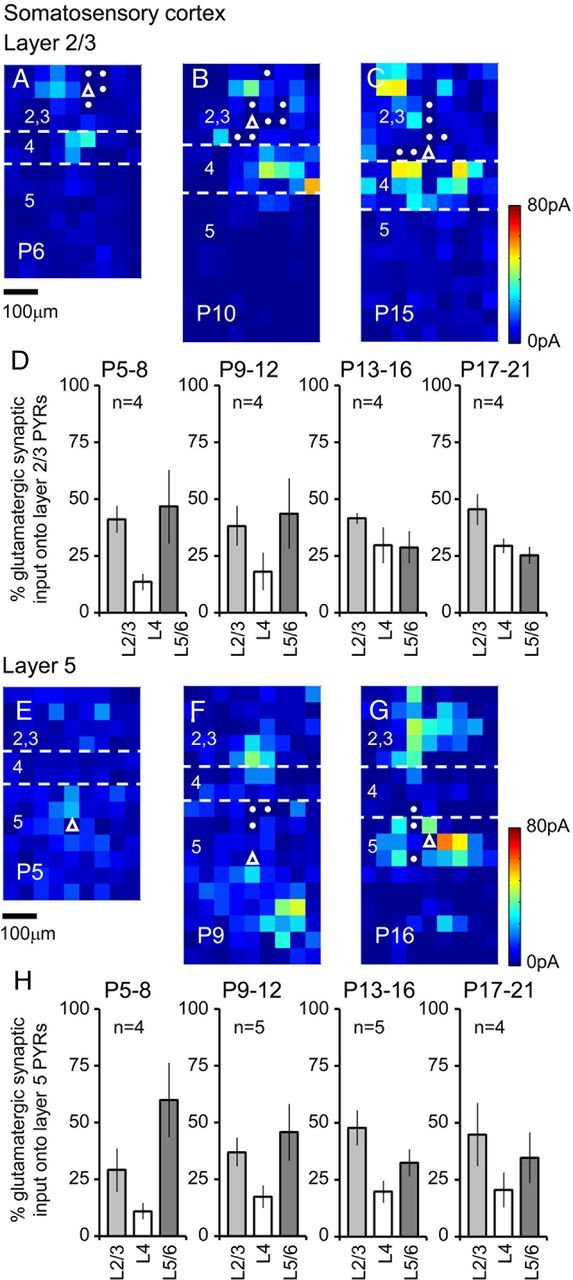
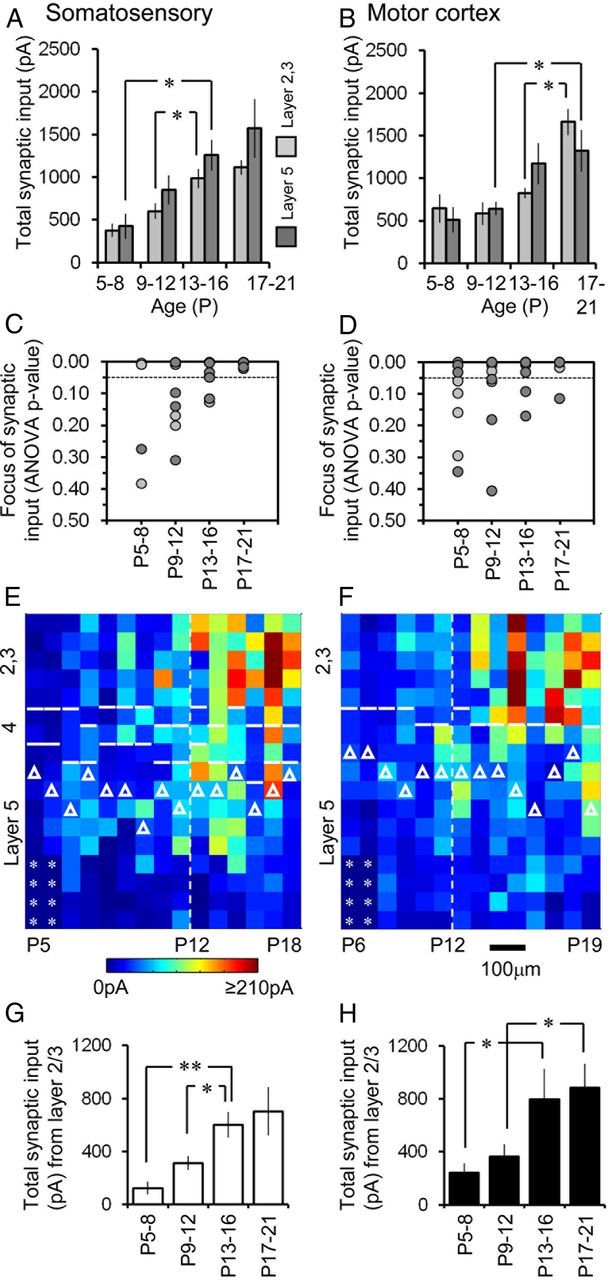
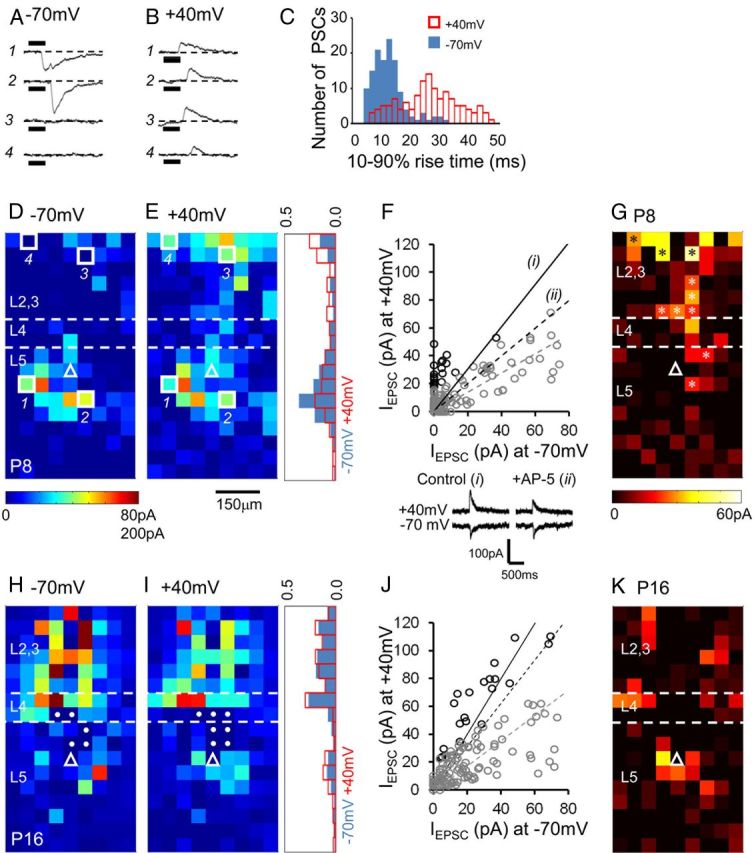
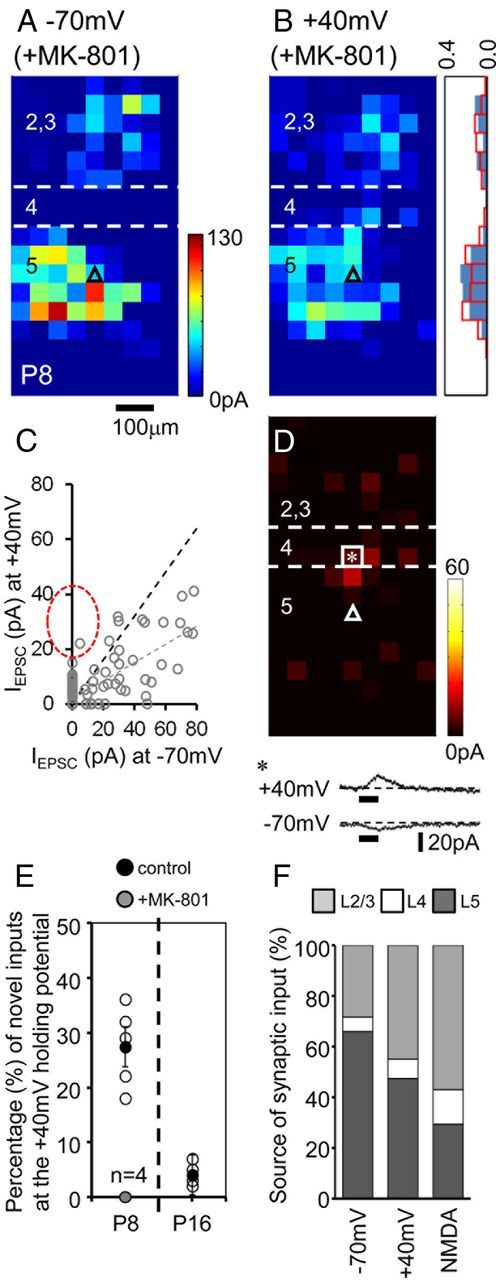
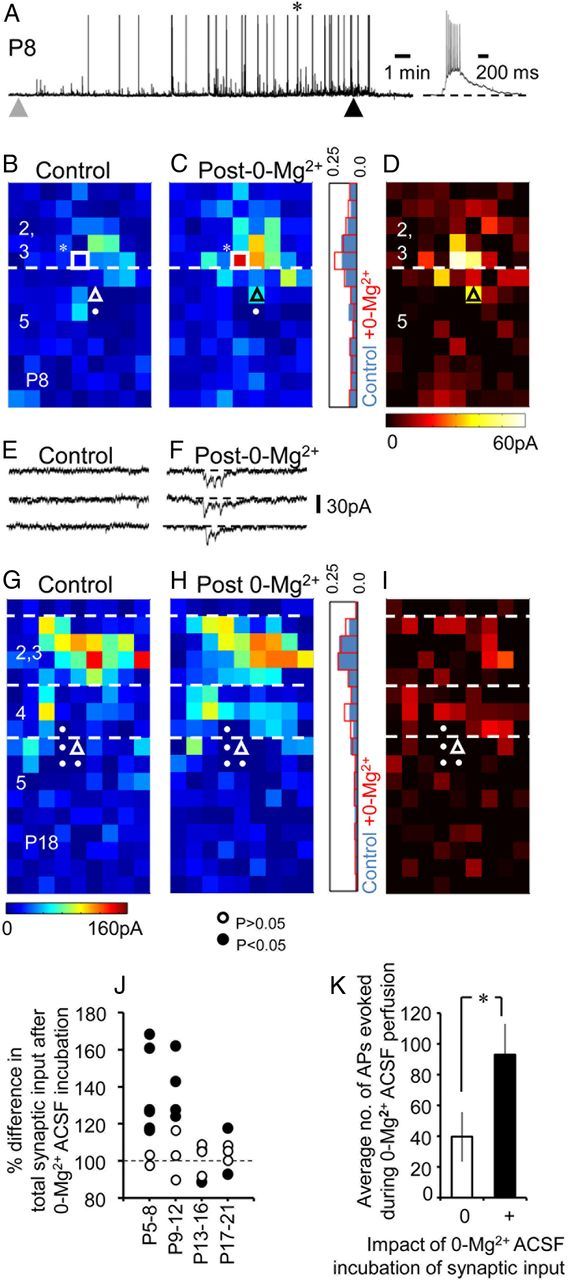
The integration of neurons within the developing cerebral cortex is a prolonged process dependent on a combination of molecular and physiological cues. To examine the latter we used laser scanning photostimulation (LSPS) of caged glutamate in conjunction with whole-cell patch-clamp electrophysiology to probe the integration of pyramidal cells in the sensorimotor regions of the mouse neocortex. In the days immediately after postnatal day 5 (P5) the origin of the LSPS-evoked AMPA receptor (AMPAR)-mediated synaptic inputs were diffuse and poorly defined with considerable variability between cells. Over the subsequent week this coalesced and shifted, primarily influenced by an increased contribution from layers 2/3 cells, which became a prominent motif of the afferent input onto layer 5 pyramidal cells regardless of cortical region. To further investigate this particular emergent translaminar connection, we alternated our mapping protocol between two holding potentials (-70 and +40 mV) allowing us to detect exclusively NMDA receptor (NMDAR)-mediated inputs. This revealed distal MK-801-sensitive synaptic inputs that predict the formation of the mature, canonical layer 2/3 to 5 pathway. However, these were a transient feature and had been almost entirely converted to AMPAR synapses at a later age (P16). To examine the role of activity in the recruitment of early NMDAR synapses, we evoked brief periods (20 min) of rhythmic bursting. Short intense periods of activity could cause a prolonged augmentation of the total input onto pyramidal cells up until P12; a time point when the canonical circuit has been instated and synaptic integration shifts to a more consolidatory phase.


Figures

Figure 1.
Figure 1.
Adjustment and calibration of laser intensity according to postnatal developmental time point. A, To establish the approximate area excited by LSPS-evoked glutamate uncaging, the UV laser (355 nm; 100 ms duration) was repeatedly fired at a range of intensities (from left to right: 10%, 25%, 40% of maximal laser power at the slice interface) in the immediate vicinity of the recorded P10 pyramidal cell (white triangle, left panel) at target points spaced at a distance of 25 μm (white dots, left panel). Action potentials (red squares) were consistently evoked at two or more spots at higher intensities. Raw current-clamp traces from the numbered laser target points at 25% laser power (middle panel) are shown in B. B, Superimposed traces from two repeats (red and blue traces) at 25% laser power. Direct responses matched the duration (100 ms) of the laser pulse (bold black line under the traces). C, Reconstructed morphology of a P6, layer 5 pyramidal cell. At early ages the relatively simple dendritic arbors with numerous small neurites (arrow) required careful adjustment of the laser intensity. D, Direct stimulation profiles of the cell (C) at a range of laser powers; only spots in the immediate vicinity of the recorded cell are shown for clarity; full averaged response maps are shown in E and F. Inset, Diagram of the 150 × 150 μm grid with the location of the cell soma target spot indicated by the triangle. E, F, Complete direct stimulation maps of the cell shown in C and D at 25 and 12% laser power, respectively. Calibration of the laser intensity ensured that action potentials (red squares) were only elicited when the laser was fired directly at the cell soma (indicated by the white triangles) during the columnar LSPS mapping (50 μm spaced grid). The laser spots enclosed by the white dashed box correspond to those points shown in D; the layer 2/3 to 5 boundary (white dashed line) is approximated to the nearest 50 μm. Calibration of the laser intensity required to evoke action potentials at the cell soma revealed increased power for layer 2/3 (G), layer 5 (H), and a smaller sample of layer 4 (I) pyramidal cells over the developmental period studied; all values ±SEM.
Figure 2.
Figure 2.
Capture of putative monosynaptic EPSCs elicited in response to reliable, long-duration photostimulation. A, B, Frequency histograms of the first (black) and last (gray) action potentials recorded in current-clamp mode in response to firing the calibrated laser pulses (100 ms; bold black line above the graphs) directly at the cell soma for both early (A) and late (B) time points (n = 46 and 59 photostimulation events, respectively). C, D, The number of EPSCs per 10 ms bin recorded under voltage-clamp conditions (in HDC ACSF) in response to firing the laser across the whole extent of the mapping grid. The arbitrary window used to pull out putative monosynaptic EPSCs (see text for full details) is highlighted by the gray histogram bars. E, F, A similar proportion of the recorded EPSCs was captured at both ages using our arbitrary criteria as revealed by the cumulative frequency plots.
Figure 3.
Figure 3.
Application of LSPS to map emergent connectivity of neocortical pyramidal cells across layers 2/3 and 5. A, A tuned (only evoking 2–3 action potentials), direct current-clamp response to LSPS evoked by targeting the UV laser at the soma of the recorded pyramidal cell. B, Voltage-clamp responses observed after the laser was fired at spots distal to the recorded pyramidal cell. The onset of the laser pulse is indicated by the left vertical dashed line, the duration (100 ms) is indicated by the horizontal red line. The onset of the analysis window (shaded gray) is marked with the middle vertical dashed line and the offset—which occurs 100 ms after the last action potential from the direct response profile (shown in A)—is marked by the right vertical dashed line. The arrow, trace 2, indicates an EPSC that would be excluded from the data analysis. C, A single-sweep, raw EPSC input map for a P17 layer pyramidal cell (the location of the soma denoted by the white triangle). Numbered squares refer to the traces shown in B; squares with circles indicate target sites with large-amplitude, direct glutamate-uncaging responses; open circles indicate points at which EPSCs were observed after repeat runs of the same map; sites with low-amplitude direct responses in which EPSCs were included are indicated by the white asterisks. Inset, Corresponding DAPI (4′,6′-diamidino-2-phenylindole dihydrochloride) stain (blue) of the somatosensory cortex shown to scale with immunohistochemistry for CTIP2 (red) to delineate approximate layer boundaries. D, The reduction in variability (error) associated with repeated mapping for 3 cells mapped at P11–P12. E, Average map (n = 6 sweeps) for the cell shown in A–C; approximate (to the nearest 50 μm on the vertical axis) layer boundaries delineated by white dashed lines. The location of the recorded cell is shown by the white triangle; squares with filled circles indicate target sites with large-amplitude, direct glutamate-uncaging responses that precluded the analysis of EPSCs at this target spot. Inset, Histogram showing the distribution of synaptic input (summed for each 50 μm grid line) across the vertical orientation.
Figure 4.
Figure 4.
LSPS-derived synaptic input maps for motor cortex pyramidal cells throughout early postnatal development. A–C, Synaptic input maps (n ≥ 5 sweeps per cell) for pyramidal cells located in layer 2/3 of the mouse motor cortex at P6 (A), P9 (B), and P19 (C). Layer boundaries are marked with dashed white lines and the location of the recorded cells highlighted by the white open triangles; target spots with filled circles indicate those where the size of the direct glutamate-uncaging responses precluded analysis of the synaptic input. D, Percentage input (±SEM) onto layer 2/3 motor cortex pyramidal cells; light gray histogram bars, input from layer 2/3; dark gray, input from layer 5/6. E–G, Example synaptic input maps for layer 5 motor cortex pyramidal cells recorded at P6 (E), P14 (F), and P17 (G). H, Percentage input similar to that shown in D but for layer 5 pyramidal cells. Amplitude (pA) calibrations for A–C and E–G are shown adjacent to C and G, respectively. All maps are shown to the same micrometer scale (indicated under A and E).
Figure 5.
Figure 5.
LSPS-derived synaptic input maps for somatosensory cortex pyramidal cells throughout early postnatal development. A–C, Synaptic input maps (n ≥ 5 sweeps per cell) for pyramidal cells located in layer 2/3 of the mouse somatosensory cortex at P6 (A), P10 (B), and P15 (C). Layer boundaries are marked with dashed white lines and the location of the recorded cells highlighted by the white open triangles; target spots with filled circles indicate those where the size of the direct glutamate-uncaging responses precluded analysis of the synaptic input. D, Percentage input (±SEM) onto layer 2/3 somatosensory cortex pyramidal cells; light gray histogram bars, input from layer 2/3; white bars, input from layer 4; dark gray, input from layer 5/6. Example synaptic input maps for layer 5 somatosensory cortex pyramidal cells recorded at P5 (E), P9 (F), and P16 (G). H, The percentage input onto the recorded cells is shown, similar to D but for afferent input onto layer 5 pyramidal cells. Amplitude (pA) calibrations for A–C and E–G are shown adjacent to C and G, respectively. All maps are shown to the same micrometer scale (indicated under A and E).
Figure 6.
Figure 6.
Development of synaptic input onto somatosensory and motor cortex pyramidal cells. A, Histogram showing the average (±SEM) total synaptic input onto layer 2/3 (light gray) and 5 (dark gray) somatosensory pyramidal cells over development (*p < 0.05, significant difference in the population data; Student's t test). B, Corresponding data for motor cortex. C, The degree to which synaptic input was distributed across the vertical orientation of map was determined using a one-way ANOVA with a null hypothesis that the input onto the recorded somatosensory cell was evenly distributed across this axis. Each data point represents a single cell located in either layer 2/3 (light gray) or 5 (dark gray); the null hypothesis was rejected when p < 0.05; p = 0.05 is indicated by the dashed line. D, Corresponding data for motor cortex. E, Side view of a group of input maps for somatosensory cortex layer 5 (predominantly layer 5a) pyramidal cells over development, ordered according to increasing age from left to right (the age of each cell has not been annotated for clarity). Cell body location indicated by the white triangles; layer boundaries indicated by the white lines; asterisks indicate points not targeted during LSPS in shortened P5–P6 postnatal maps. F, Side view of motor cortex layer 5 pyramidal cell input maps similar to that shown for somatosensory cortex in E; amplitude (pA) calibration for E and F shown under E; micrometer scale shown under F. G, H, Development of synaptic input on somatosensory (white histogram bars) and motor (black histogram bars) cortex layer 5 pyramidal cells, respectively. All values reported ±SEM; indicated by asterisk, *p < 0.05, **p < 0.01, significant difference (Student's t test) in the populations.
Figure 7.
Figure 7.
The presence of distal, putative NMDAR-mediated afferent inputs mapped in the early postnatal cortex. A, B, Voltage-clamp recordings of synaptic input elicited in response to LSPS at four separate laser target points in a P8, layer 5 pyramidal cell recording (numbers correspond to the sites indicated in D, E). C, Distribution of EPSC 10–90% rise times obtained from −70 mV and +40 mV holding potentials for the same cell. D, E, Complete synaptic input map of the P8, layer 5 pyramidal cell recorded at a holding potential of −70 mV (D; calibration maximum 80 pA) and +40 mV (E). The histogram adjacent to E indicates the normalized input measured across the vertical axis for the two holding potentials (blue bars, −70 mV; red open bars, +40 mV). F, Plot comparing the amplitude of the evoked EPSCs for each laser target spot. Black circles, The top ranked (Wilcoxon signed rank test) observations with a bias toward the response observed at +40 mV. The black line (i) corresponds to the expected glutamate response ratio calculated from the recorded somatic direct glutamate response (see inset below the graph). Dashed, black line (ii), The AMPA glutamate response ratio measured in the presence of 20 μm AP-5; gray dashed line, linear regression for all the observed synaptic responses. G, Difference in the observed response between −70 mV and +40 mV holding potentials; asterisks highlight novel +40 mV responses. H, Synaptic inputs mapped onto a P16 layer 5 pyramidal cell at a holding potential of −70 mV; pixels with a filled circle indicate target sites with large-amplitude, direct glutamate-uncaging responses that precluded the analysis of EPSCs at this target spot. I, Corresponding inputs onto the same cell as in G but at +40 mV. Inset, Histogram showing the normalized input across the vertical axis for both holding potentials. J, Plot comparing the amplitude of the evoked EPSCs for each laser target spot as shown in F but for a P16 pyramidal cell. K, Pixel map showing the location of the target points with a pronounced +40 mV (NMDAR) contribution identified in the P16 pyramidal cell mapped in H and I.
Figure 8.
Figure 8.
Synaptic nature and source of the NMDA receptor-mediated input in the early (P8) neocortex. A, B, LSPS maps recorded from a layer 5 somatosensory pyramidal cell at holding potentials of −70 mV (A) and −40 mV (B) which had previously been incubated for 45 min in 4 μm bicuculline and 5 μm MK-801. Inset, Histogram showing the normalized input across the vertical axis. C, Plot comparing the amplitude of the evoked EPSCs for each laser target spot. The dashed black line indicates the ratio expected from the observed somatic direct glutamate; the gray dashed line, linear regression for all the observed synaptic responses; the red dashed oval, expected distribution for exclusively NMDAR responses observed under control conditions. D, Plot of laser target points with evoked synaptic responses biased toward that observed at the +40 mV holding potential; a direct glutamate response that is more prominent at +40 mV is shown below and was identified from the laser target point highlighted by the white square and asterisk. E, Plot of the percentage of novel synaptic inputs observed at a holding potential of +40 mV in control cells (white circles for individual cells; average indicated by the black circle ±SEM) mapped at either P8 (n = 5) or P16 (n = 4); light gray data points indicate the equivalent data obtained from P8 cells preincubated in MK-801 (n = 4). F, Histogram showing the average percentage afferent input from each layer impacting on P8 layer 5 pyramidal cells recorded at the different holding potentials (n = 5); NMDA, the layer source of the novel input observed at +40 mV.
Figure 9.
Figure 9.
Activity-dependent enhancement of synaptic input onto early (≤P12) postnatal pyramidal cells. A, Impact of 20 min 0-Mg2+ ACSF incubation on sub- and suprathreshold activity levels in a P8 pyramidal cell; gray and black arrowheads, onset and end of 0-Mg2+ ACSF perfusion, respectively. Inset, A burst of action potentials marked with an asterisk in the main trace shown on an expanded time scale. B, C, Average synaptic input maps onto a P8, layer 5 motor cortex pyramidal cell under baseline conditions (Control; B) and after recovery from 20 min incubation in 0-Mg2+ ACSF (Post-0-Mg2+; C). The histogram adjacent to C indicates the normalized sum of inputs across the vertical axis for the control (blue) and post-activity (red line) maps. The white square and asterisk indicates the laser target spot from which 3 repeat voltage-clamp traces are shown below the maps for each condition (E, F). D, Plot showing laser target points that showed an increase in synaptic input following 0-Mg2+ ACSF perfusion. G–I, Data presented in a manner similar to the cell shown in B–D but for a P17, layer 5 somatosensory pyramidal cell. J, A plot showing the impact of 20 min incubation with 0-Mg2+ ACSF on the total synaptic input onto pyramidal cells plotted over the development time window examined. Black circles indicate a significant (two-tailed Wilcoxon signed-rank test; p < 0.05) difference in total synaptic input between control and post-0-Mg2+ maps. K, Histogram showing the average number of action potentials (APs) recorded during the 20 min 0-Mg2+ ACSF perfusion for all the P5–P12 pyramidal cells that showed no (white bar) or alternatively a significant change (p < 0.05) in total synaptic input.

References

    1. Abrahamsson T, Gustafsson B, Hanse E. AMPA silencing is a prerequisite for developmental long-term potentiation in the hippocampal CA1 region. J Neurophysiol. 2008;100:2605–2614. - PubMed
    1. Agmon A, Connors BW. Repetitive burst-firing neurons in the deep layers of mouse somatosensory cortex. Neurosci Lett. 1989;99:137–141. - PubMed
    1. Allène C, Cossart R. Early NMDA receptor-driven waves of activity in the developing neocortex: physiological or pathological network oscillations? J Physiol. 2010;588:83–91. - PMC - PubMed
    1. Allène C, Cattani A, Ackman JB, Bonifazi P, Aniksztejn L, Ben-Ari Y, Cossart R. Sequential generation of two distinct synapse-driven network patterns in developing neocortex. J Neurosci. 2008;28:12851–12863. - PMC - PubMed
    1. Anderson CT, Sheets PL, Kiritani T, Shepherd GM. Sublayer-specific microcircuits of corticospinal and corticostriatal neurons in motor cortex. Nat Neurosci. 2010;13:739–744. - PMC - PubMed

Publication types

MeSH terms

LinkOut - more resources