

Leading causes of unintentional and intentional injury mortality: United States, 2000-2009
- PMID: 22994256
- PMCID: PMC3477930
- DOI: 10.2105/AJPH.2012.300960
Leading causes of unintentional and intentional injury mortality: United States, 2000-2009
Abstract
Objectives: We have described national trends for the 5 leading external causes of injury mortality.
Methods: We used negative binomial regression and annual underlying cause-of-death data for US residents for 2000 through 2009.
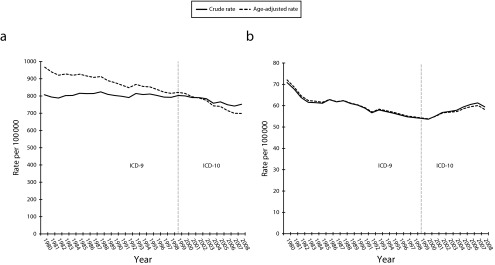
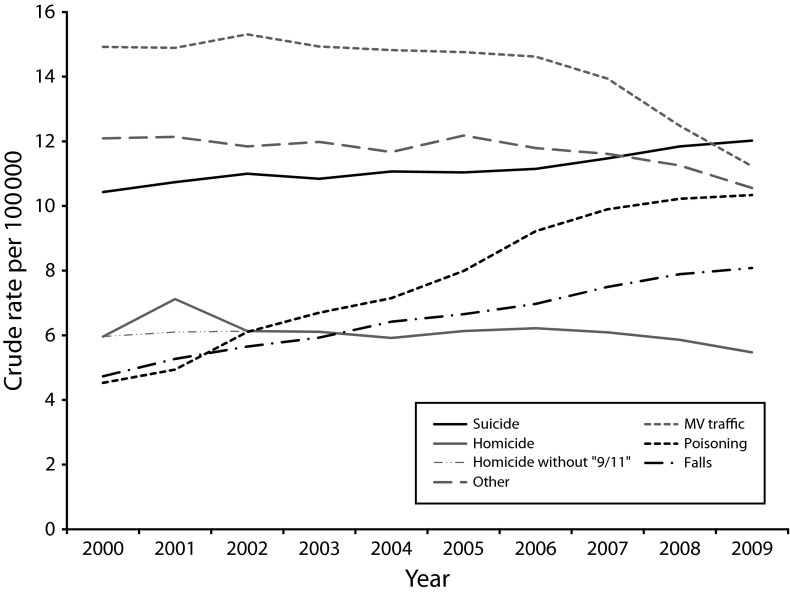
Results: Mortality rates for unintentional poisoning, unintentional falls, and suicide increased by 128%, 71%, and 15%, respectively. The unintentional motor vehicle traffic crash mortality rate declined 25%. Suicide ranked first as a cause of injury mortality, followed by motor vehicle traffic crashes, poisoning, falls, and homicide. Females had a lower injury mortality rate than did males. The adjusted fall mortality rate displayed a positive age gradient. Blacks and Hispanics had lower adjusted motor vehicle traffic crash and suicide mortality rates and higher adjusted homicide rates than did Whites, and a lower unadjusted total injury mortality rate.
Conclusions: Mortality rates for suicide, poisoning, and falls rose substantially over the past decade. Suicide has surpassed motor vehicle traffic crashes as the leading cause of injury mortality. Comprehensive traffic safety measures have successfully reduced the national motor vehicle traffic crash mortality rate. Similar efforts will be required to diminish the burden of other injury.
Figures
References
-
- US Census Bureau. The 2012 Statistical Abstract: Life Expectancy. Available at: http://www.census.gov/compendia/statab/2012/tables/12s0105.pdf. Accessed March 5, 2012.
-
- Centers for Disease Control and Prevention. Wide-Ranging Online Data for Epidemiologic Research. Available at: http://wonder.cdc.gov/controller/datarequest/D67. Accessed November 29, 2011.
-
- Centers for Disease Control and Prevention. Web-Based Injury Statistics Query and Reporting System. Available at: http://webappa.cdc.gov/sasweb/ncipc/mortrate10_us.html. Accessed January 26, 2012.
Publication types
MeSH terms
Grants and funding
LinkOut - more resources
Full Text Sources
Medical
Miscellaneous
