

Whole transcriptome analysis of the silicon response of the diatom Thalassiosira pseudonana
- PMID: 22994549
- PMCID: PMC3478156
- DOI: 10.1186/1471-2164-13-499
Whole transcriptome analysis of the silicon response of the diatom Thalassiosira pseudonana
Abstract
Background: Silicon plays important biological roles, but the mechanisms of cellular responses to silicon are poorly understood. We report the first analysis of cell cycle arrest and recovery from silicon starvation in the diatom Thalassiosira pseudonana using whole genome microarrays.
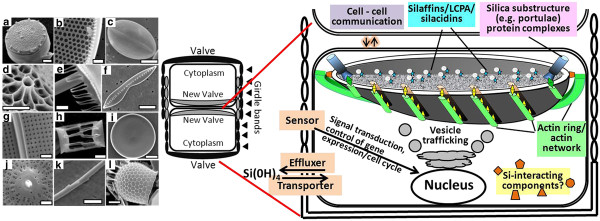
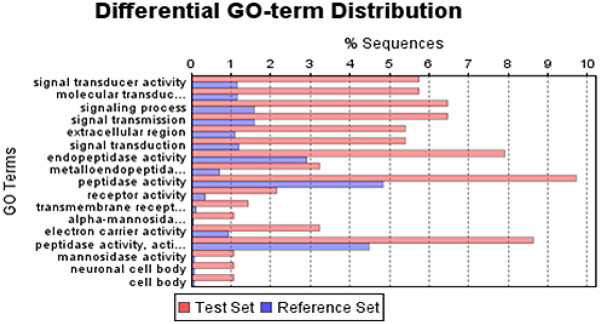
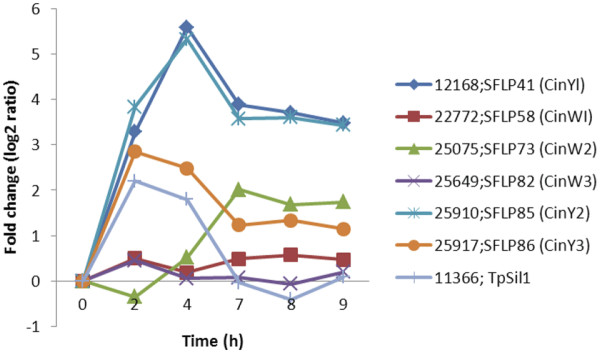
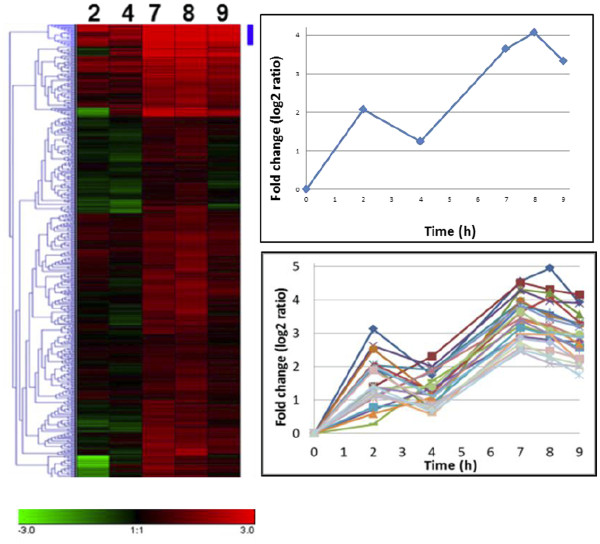
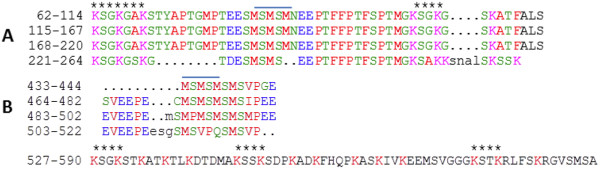
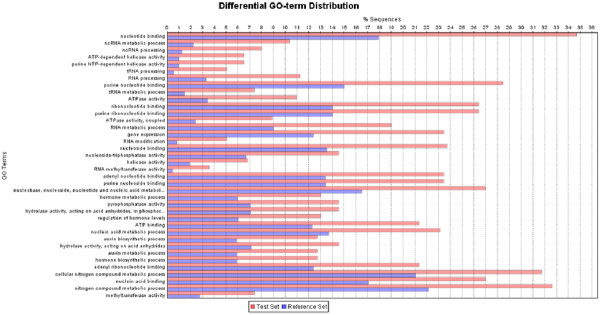
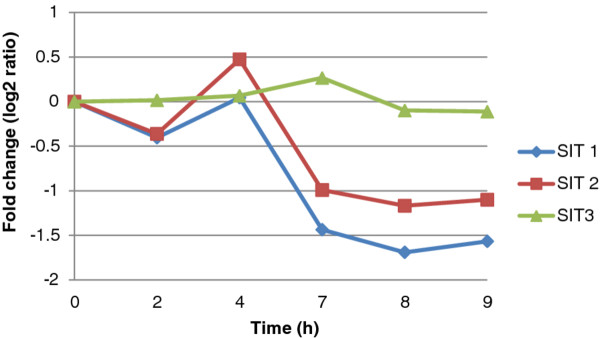
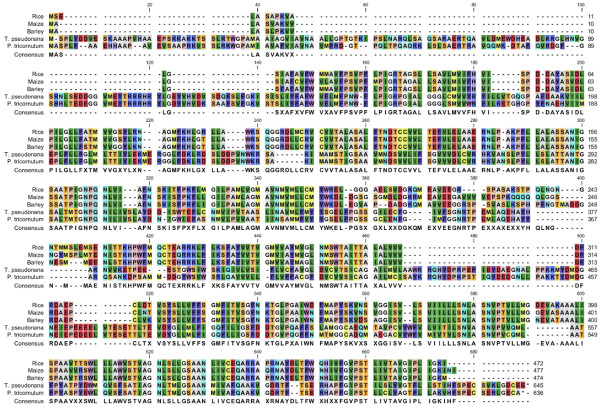
Results: Three known responses to silicon were examined, 1) silicified cell wall synthesis, 2) recovery from silicon starvation, and 3) co-regulation with silicon transporter (SIT) genes. In terms of diatom cell wall formation, thus far only cell surface proteins and proteins tightly associated with silica have been characterized. Our analysis has identified new genes potentially involved in silica formation, and other genes potentially involved in signaling, trafficking, protein degradation, glycosylation and transport, which provides a larger-scale picture of the processes involved. During silicon starvation, an overrepresentation of transcription and translation related genes were up-regulated, indicating that T. pseudonana is poised to rapidly recover from silicon starvation and resume cell cycle progression upon silicon replenishment. This is in contrast to other types of limitation, and provides the first molecular data explaining the well-established environmental response of diatoms to grow as blooms and to out-compete other classes of microalgae for growth. Comparison of our data with a previous diatom cell cycle analysis indicates that assignment of the cell cycle specific stage of particular cyclins and cyclin dependent kinases should be re-evaluated. Finally, genes co-varying in expression with the SITs enabled identification of a new class of diatom-specific proteins containing a unique domain, and a putative silicon efflux protein.
Conclusions: Analysis of the T. pseudonana microarray data has provided a wealth of new genes to investigate previously uncharacterized cellular phenomenon related to silicon metabolism, silicon's interaction with cellular components, and environmental responses to silicon.
Figures
References
-
- Carlisle EM. In: Silicon and Siliceous Structures in Biological Systems. Simpson TL, Volcani BE, editor. Springer-Verlag, New York; 1981. Silicon in bone formation; pp. 69–94.
-
- Round FE, Crawford RM, Mann DG. The Diatoms: Biology and Morphology of the Genera. Cambridge University Press, Bath; 1990.
-
- Hildebrand M, Frigeri LG, Davis AK. Synchronized growth of Thalassiosira pseudonana (Bacillariophyceae) provides novel insights into cell-wall synthesis processes in relation to the cell cycle. J Phycol. 2007;43:730–740. doi: 10.1111/j.1529-8817.2007.00361.x. - DOI
Publication types
MeSH terms
Substances
Associated data
- Actions
LinkOut - more resources
Full Text Sources
Molecular Biology Databases
