Comparative Study
. 2012 Dec;12(12):3449-61.
doi: 10.1111/j.1600-6143.2012.04269.x. Epub 2012 Sep 20.

Differing effects of rapamycin or calcineurin inhibitor on T-regulatory cells in pediatric liver and kidney transplant recipients

Affiliations
Comparative Study

Differing effects of rapamycin or calcineurin inhibitor on T-regulatory cells in pediatric liver and kidney transplant recipients

T Akimova et al. Am J Transplant. 2012 Dec.

Abstract

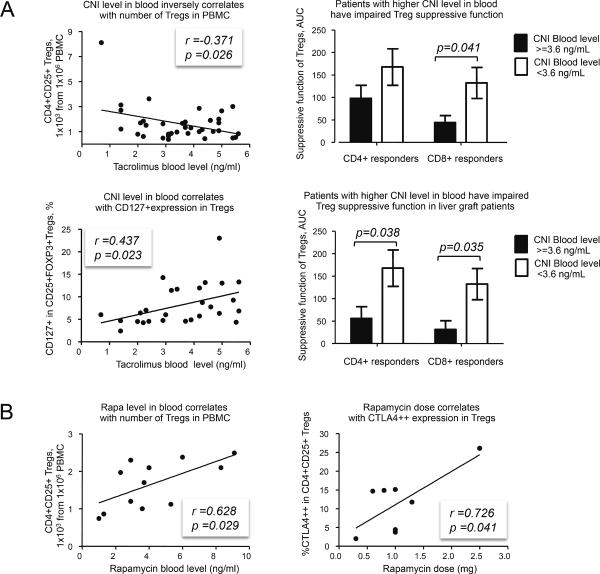
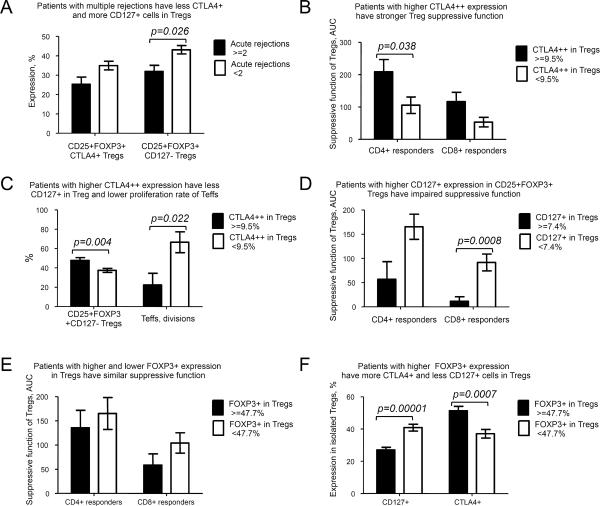
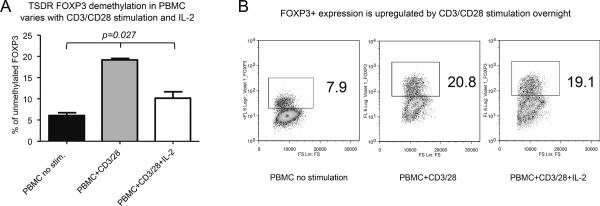
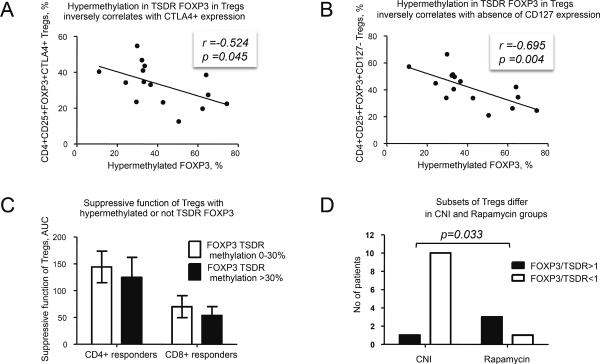
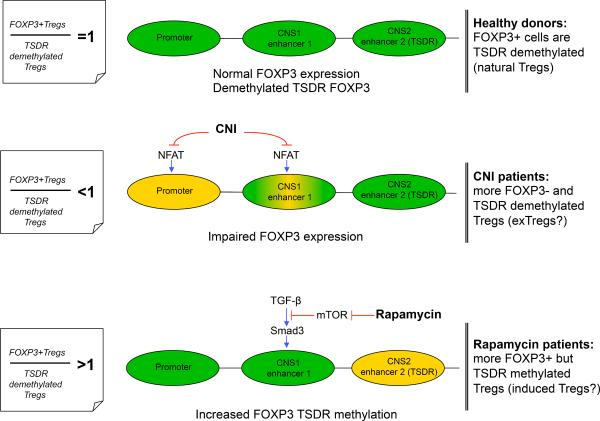
In a cross-sectional study, we assessed effects of calcineurin inhibitor (CNI) or rapamycin on T-regulatory (Treg) cells from children with stable liver (n = 53) or kidney (n = 9) allografts several years posttransplant. We analyzed Treg number, phenotype, suppressive function, and methylation at the Treg-specific demethylation region (TSDR) using Tregs and peripheral blood mononuclear cells. Forty-eight patients received CNI (39 as monotherapy) and 12 patients received rapamycin (9 as monotherapy). Treg numbers diminished over time on either regimen, but reached significance only with CNI (r =-0.424, p = 0.017). CNI levels inversely correlated with Treg number (r =-0.371, p = 0.026), and positively correlated with CD127+ expression by Tregs (r = 0.437, p = 0.023). Patients with CNI levels >3.6 ng/mL had weaker Treg function than those with levels <3.6 ng/mL, whereas rapamycin therapy positively correlated with Treg numbers (r = 0.628, p = 0.029) and their expression of CTLA4 (r = 0.726, p = 0.041). Overall, CTLA4 expression, TSDR demethylation and an absence of CD127 were important for Treg suppressive function. We conclude that rapamycin has beneficial effects on Treg biology, whereas long-term and high dose CNI use may impair Treg number, function and phenotype, potentially acting as a barrier to attaining host hyporesponsiveness to an allograft.


Figures

Figure 1
Figure 1. Effects of CNI and Rapamycin on Tregs
(A) Left column: CNI level in blood inversely correlates with CD4+CD25+Tregs number in PBMC (36 patients) and positively correlates with CD127 expression in CD4+CD25+FOXP3+ Tregs (27 patients). Right column: all patients (top) or liver graft patients (bottom) were divided into 2 groups according to mean of CNI blood level, >3.6 ng/ml and <3.6 ng/ml. Patients with higher CNI level showed impaired Treg ability to suppress divisions of CD4+ or CD8+ healthy donor responder cells (20 patients). Suppression was calculated as AUC (see Material and Methods and Figure S1). Compared groups had no differences in FOXP3 expression. (B) Rapamycin therapy positively correlates with CD4+CD25+ Treg number in PBMC (12 patients) and with CTLA4++ expression in Tregs (8 patients). Partial correlation assay with FOXP3 as potential controlling variable showed that rapamycin use still correlated with CTLA4++ expression in Tregs when effects of FOXP3 were removed (r=0.866, p=0.012).
Figure 2
Figure 2. Correlations of CTLA4, CD127 and FOXP3 with Treg suppression and clinical variables
(A) 28 patients receiving CNI were divided into 2 groups: those with a history of multiple rejections (≥2) and those with less than 2 acute rejection episodes. Patients who had experienced multiple rejections had less CTLA4+ (p=0.07, not significant) and more CD127 in FOXP3+ Tregs. (B), (C) Patients were divided into 2 groups: with high CTLA++ expression in isolated Tregs (≥9.5%) and decreased CTLA4++ expression (<9.5%). Patients with higher CTLA4++ expression have (B) stronger Treg suppressive function (p=0.038 for CD4+ responders and not significant p=0.073 for CD8+ responders, 21 patients) and (C) lower CD127+ expression in Tregs (37 patients) with lower ex vivo proliferative abilities of patient CD4+CD25− responders (13 patients). (D) Patients with higher CD127+ expression in CD4+CD25+FOXP3+Tregs (≥7.4%) have impaired suppressive function in comparison with those who have less CD127 in Tregs (not significant p=0.066 for CD4+ responders and p=0.0008 for CD8+ responders, 21 patients). Suppression of both CD4+ and CD8+ responders strongly correlated with each other in all tested groups (r=0.8, p<0.0001 for all patients) and CD127+ expression in Tregs inversely correlated with CTLA4 expression in all tested groups (r=−0.552, p<0.001 for CTLA4+, r=−0.381, p=0.019 for CTLA4++ for all patients). (E) Patients with higher (≥47.7%) or lower FOXP3 expression in isolated Tregs did not differ with regard to suppressive function (136 AUC vs. 165 AUC, p=0.55 for CD4+ responders, 58 AUC vs. 104 AUC for CD8+ responders, p=0.16, 21 patients), but (F) differed in CD127 and CTLA4 expression, 37 patients.
Figure 3
Figure 3. FOXP3 TSDR-demethylation in PBMC is sensitive to CD3/CD28 stimulation and/or IL-2
Healthy donor PBMC were stimulated overnight with CD3/CD28 mAb-coated beads (1:1) ± IL-2 (100 U/ml). Cells were split and stained for CD4, CD25 and FOXP3, or used to isolate DNA and test TSDR-demethylation. (A) Compared with untreated controls, CD3/CD28 stimulation increased TSDR-demethylation in PBMC, from 5.3 to 19.7% without IL-2, and to 10.2% with IL-2, p=0.0273, Kruskal-Wallis test. Dunn's multiple comparison post-test showed that untreated control differed from CD3/28 stimulated PBMC, p<0.05. (B) In parallel, CD3/CD28 stimulation led to FOXP3 upregulation from 7.2 to 20.8% (without IL-2) and to 19.1% (with IL-2) in CD4+ cells. Experiment was set up in triplicate, TSDR demethylation was tested separately for each of three wells, and flow cytometry was performed using pooled samples.
Figure 4
Figure 4. Role of TSDR-methylation in Tregs
(A) In boys, hypermethylation in TSDR correlates inversely with (A) CTLA4 expression and (B) with absence of CD127 expression in isolated CD4+CD25+FOXP3+ Tregs (15 patients). The same (and also stronger) correlations were observed in boys receiving CNI therapy: r=−0.647, p=0.032 for CD4+CD25+CTLA4+ Tregs and r=−0.838, p=0.001 for CD25+FOXP3+CD127−Tregs (11 patients). (C) Tregs, hypermethylated in TSDR (≥30% methylation adjusted to gender as HMgirls=100-((100-HM)*2) for girls where HM - % of hypermethylated-TSDR) tend to have lower suppressive function than Tregs with <30% methylation: 125 vs. 144 AUC, p=0.68 for CD4+ responders and 55 vs. 70, p=0.54 for CD8+ responders (17 patients). (D) Ratio between FOXP3+ Tregs to TSDR-demethylated Tregs in isolated suppressive CD4+CD25+ cells (FOXP3/TSDR) was calculated in boys in CNI vs. rapamycin groups (15 patients). Most patients in CNI group have FOXP3/TSDR ratios <1, while most patients in the rapamycin group have FOXP3/TSDR ratios >1. An absolute percent of TSDR-demethylation in Tregs was similar in CNI and rapamycin groups (not shown).
Figure 5
Figure 5. Basis for different FOXP3/TSDR ratios in Tregs from CNI and Rapamycin groups
To initiate FOXP3 gene transcription, the FOXP3 promoter and at least 1 of 2 enhancer elements must be activated. In natural Tregs, enhancer 2 (TSDR) is demethylated, resulting in sustained FOXP3 expression. In peripherally induced Tregs, TGF-β sensitive enhancer is activated, leading to transient FOXP3 expression. Top: in healthy donors, most Tregs are natural thymic-derived cells expressing FOXP3 and demethylated at the TSDR. Middle: CNI exposure disrupts NFAT signaling, leading to impaired FOXP3 promoter activation (14) and, as a result, leads to an increased percent of TSDR-demethylated (in CNS2 region) cells that are unable to activate FOXP3 transcription, within CD4+CD25+ Tregs. The enhancer 1 region may also be sensitive to CNI, since TGF-β activated induction occurs through the cooperation of NFAT and Smad3 and that can lead to further aggravation of impaired FOXP3 expression in Tregs. Bottom: Activation of enhancer 1 through TGF-β-dependent and TGF-β-independent pathways (the latter not shown in schematic) can be disrupted by AKT-mTOR activity and inhibited by rapamycin, resulting in increased numbers of FOXP3+ peripherally induced Tregs with TSDR-methylated FOXP3. Green regions are active, yellow regions are partially inactive.

Similar articles

Cited by

References

    1. Srinivas TR, Kaplan B. Transplantation in 2011: New agents, new ideas and new hope. Nature reviews Nephrology. 2012;8:74–75. - PubMed
    1. Boros P, Bromberg JS. Human FOXP3+ regulatory T cells in transplantation. Am J Transplant. 2009;9:1719–1724. - PMC - PubMed
    1. Penninga L, Wettergren A, Chan AW, Steinbruchel DA, Gluud C. Calcineurin inhibitor minimisation versus continuation of calcineurin inhibitor treatment for liver transplant recipients. Cochrane Database Syst Rev. 2012;3:CD008852. - PMC - PubMed
    1. Zeiser R, Nguyen VH, Beilhack A, Buess M, Schulz S, Baker J, et al. Inhibition of CD4+CD25+ regulatory T-cell function by calcineurin-dependent interleukin-2 production. Blood. 2006;108:390–399. - PMC - PubMed
    1. Gao W, Lu Y, El Essawy B, Oukka M, Kuchroo VK, Strom TB. Contrasting effects of cyclosporine and rapamycin in de novo generation of alloantigen-specific regulatory T cells. Am J Transplant. 2007;7:1722–1732. - PMC - PubMed

Publication types

MeSH terms