

Intrinsic aerobic capacity correlates with greater inherent mitochondrial oxidative and H2O2 emission capacities without major shifts in myosin heavy chain isoform
- PMID: 22995392
- PMCID: PMC3524658
- DOI: 10.1152/japplphysiol.01475.2011
Intrinsic aerobic capacity correlates with greater inherent mitochondrial oxidative and H2O2 emission capacities without major shifts in myosin heavy chain isoform
Abstract
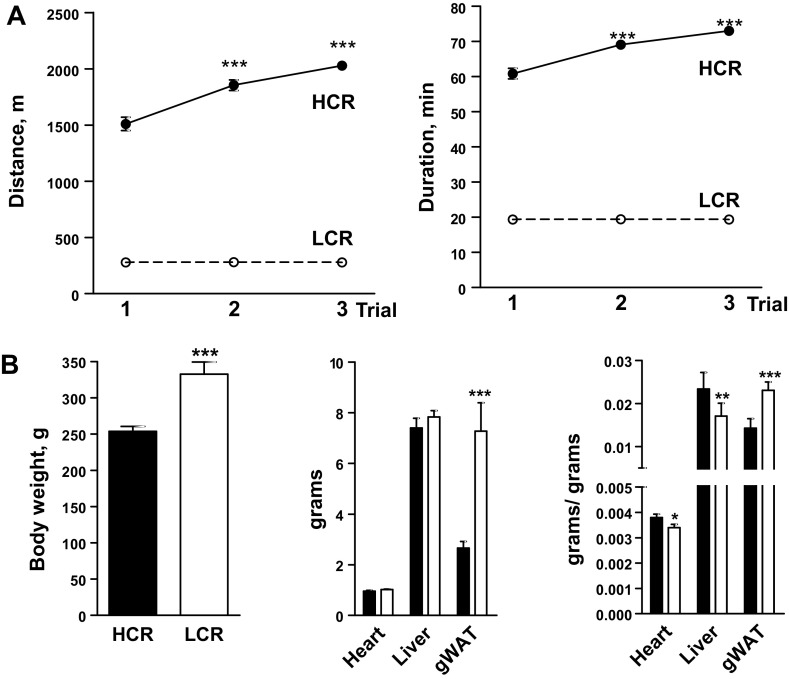
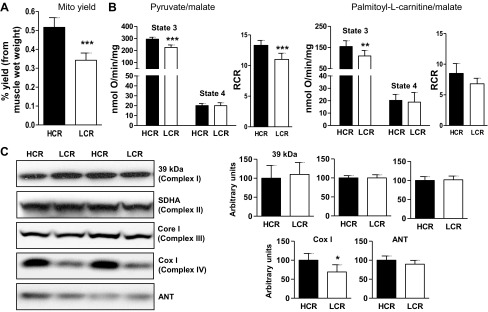
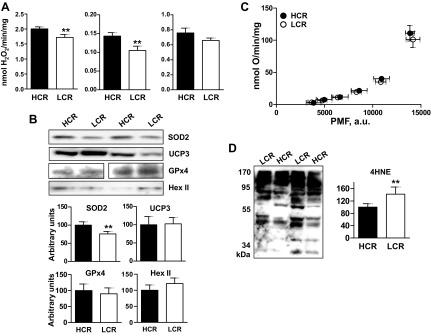
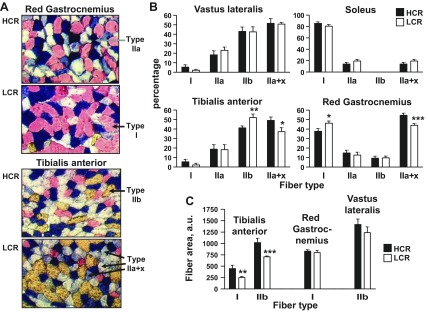
Exercise capacity and performance strongly associate with metabolic and biophysical characteristics of skeletal muscle, factors that also relate to overall disease risk. Despite its importance, the exact mechanistic features that connect aerobic metabolism with health status are unknown. To explore this, we applied artificial selection of rats for intrinsic (i.e., untrained) aerobic treadmill running to generate strains of low- and high-capacity runners (LCR and HCR, respectively), subsequently shown to diverge for disease risk. Concurrent breeding of LCR and HCR per generation allows the lines to serve as reciprocal controls for unknown environmental changes. Here we provide the first direct evidence in mitochondria isolated from skeletal muscle that intrinsic mitochondrial capacity is higher in HCR rats. Maximal phosphorylating respiration was ~40% greater in HCR mitochondria, independent of substrate and without altered proton leak or major changes in protein levels or muscle fiber type, consistent with altered control of phosphorylating respiration. Unexpectedly, H(2)O(2) emission was ~20% higher in HCR mitochondria, due to greater reduction of more harmful reactive oxygen species to H(2)O(2); indeed, oxidative modification of mitochondrial proteins was lower. When the higher mitochondrial yield was considered, phosphorylating respiration and H(2)O(2) emission were 70-80% greater in HCR muscle. Greater capacity of HCR muscle for work and H(2)O(2) signaling may result in enhanced and more immediate cellular repair, possibly explaining lowered disease risks.
Figures
Similar articles
-
Lower oxidative DNA damage despite greater ROS production in muscles from rats selectively bred for high running capacity.Am J Physiol Regul Integr Comp Physiol. 2011 Mar;300(3):R544-53. doi: 10.1152/ajpregu.00250.2010. Epub 2010 Dec 9. Am J Physiol Regul Integr Comp Physiol. 2011. PMID: 21148474 Free PMC article.
-
Skeletal muscle mitochondrial and metabolic responses to a high-fat diet in female rats bred for high and low aerobic capacity.Appl Physiol Nutr Metab. 2010 Apr;35(2):151-62. doi: 10.1139/H09-139. Appl Physiol Nutr Metab. 2010. PMID: 20383225 Free PMC article.
-
Peripheral oxygen transport and utilization in rats following continued selective breeding for endurance running capacity.J Appl Physiol (1985). 2009 Jun;106(6):1819-25. doi: 10.1152/japplphysiol.00914.2007. Epub 2008 Apr 17. J Appl Physiol (1985). 2009. PMID: 18420720 Free PMC article.
-
Systemic oxygen transport in rats artificially selected for running endurance.Respir Physiol Neurobiol. 2006 Apr 28;151(2-3):141-50. doi: 10.1016/j.resp.2005.09.012. Epub 2005 Dec 15. Respir Physiol Neurobiol. 2006. PMID: 16344008 Review.
-
Diversity of human skeletal muscle in health and disease: contribution of proteomics.J Proteomics. 2011 May 16;74(6):774-95. doi: 10.1016/j.jprot.2011.02.028. Epub 2011 Mar 23. J Proteomics. 2011. PMID: 21414428 Review.
Cited by
-
Voluntary Running Attenuates Metabolic Dysfunction in Ovariectomized Low-Fit Rats.Med Sci Sports Exerc. 2017 Feb;49(2):254-264. doi: 10.1249/MSS.0000000000001101. Med Sci Sports Exerc. 2017. PMID: 27669449 Free PMC article.
-
Differences in Mitochondrial Coupling Reveal a Novel Signature of Mitohormesis in Muscle of Healthy Individuals.J Clin Endocrinol Metab. 2016 Dec;101(12):4994-5003. doi: 10.1210/jc.2016-2742. Epub 2016 Oct 6. J Clin Endocrinol Metab. 2016. PMID: 27710240 Free PMC article. Clinical Trial.
-
The Emerging Roles of Nicotinamide Adenine Dinucleotide Phosphate Oxidase 2 in Skeletal Muscle Redox Signaling and Metabolism.Antioxid Redox Signal. 2019 Dec 20;31(18):1371-1410. doi: 10.1089/ars.2018.7678. Epub 2019 Nov 1. Antioxid Redox Signal. 2019. PMID: 31588777 Free PMC article. Review.
-
Assessment of in vivo skeletal muscle mitochondrial respiratory capacity in humans by near-infrared spectroscopy: a comparison with in situ measurements.J Physiol. 2014 Aug 1;592(15):3231-41. doi: 10.1113/jphysiol.2014.274456. Epub 2014 Jun 20. J Physiol. 2014. PMID: 24951618 Free PMC article.
-
Brain diabetic neurodegeneration segregates with low intrinsic aerobic capacity.Ann Clin Transl Neurol. 2014 Aug;1(8):589-604. doi: 10.1002/acn3.86. Epub 2014 Aug 19. Ann Clin Transl Neurol. 2014. PMID: 25356430 Free PMC article.
References
-
- Abdul-Ghani MA, Jani R, Chavez A, Molina-Carrion M, Tripathy D, Defronzo RA. Mitochondrial reactive oxygen species generation in obese non-diabetic and type 2 diabetic participants. Diabetologia 52: 574–582, 2009. - PubMed
-
- Anderson EJ, Lustig ME, Boyle KE, Woodlief TL, Kane DA, Lin CT, Price JW, III, Kang L, Rabinovitch PS, Szeto HH, Houmard JA, Cortright RN, Wasserman DH, Neufer PD. Mitochondrial H2O2 emission and cellular redox state link excess fat intake to insulin resistance in both rodents and humans. J Clin Invest 119: 573–581, 2009. - PMC - PubMed
-
- Arany Z, Lebrasseur N, Morris C, Smith E, Yang W, Ma Y, Chin S, Spiegelman BM. The transcriptional coactivator PGC-1beta drives the formation of oxidative type IIX fibers in skeletal muscle. Cell Metab 5: 35–46, 2007. - PubMed
-
- Bassel-Duby R, Olson EN. Signaling pathways in skeletal muscle remodeling. Annu Rev Biochem 75: 19–37, 2006. - PubMed
Publication types
MeSH terms
Substances
Grants and funding
LinkOut - more resources
Full Text Sources