. 2012 Sep 19;103(6):1198-207.
doi: 10.1016/j.bpj.2012.08.015.

K⁺ conduction and Mg²⁺ blockade in a shaker Kv-channel single point mutant with an unusually high conductance

Affiliations

K⁺ conduction and Mg²⁺ blockade in a shaker Kv-channel single point mutant with an unusually high conductance

Cristian Moscoso et al. Biophys J. .

Abstract

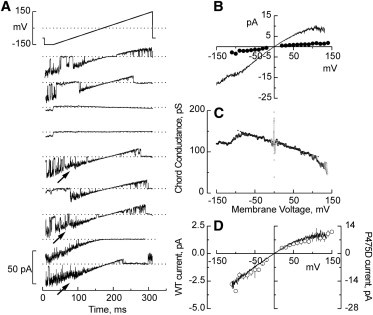
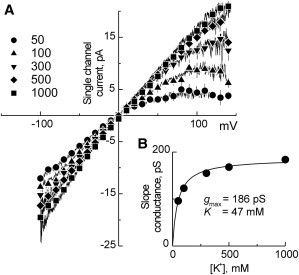
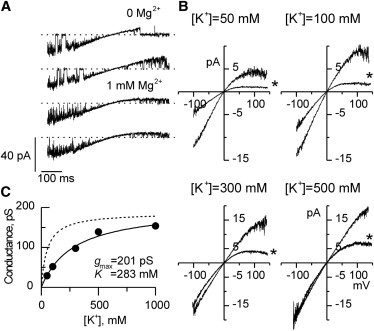
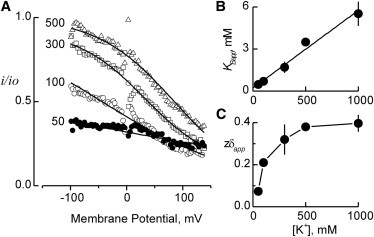
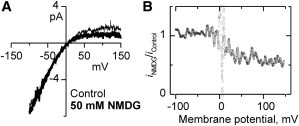
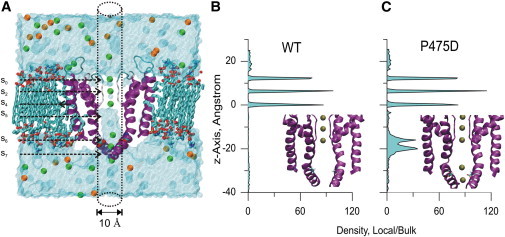
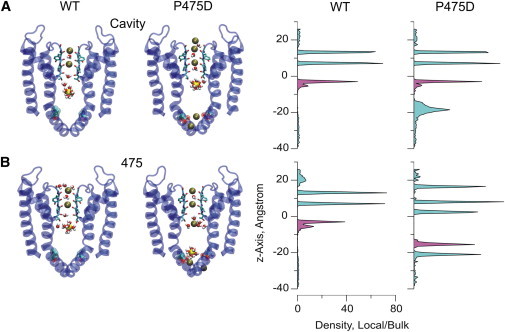
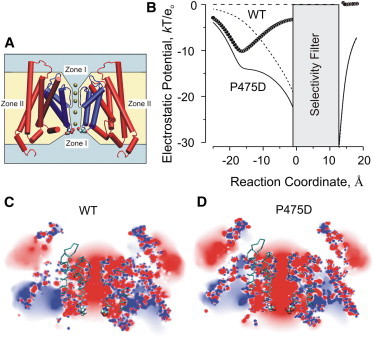
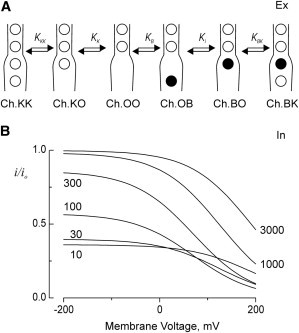
Potassium channels exhibit a large diversity of single-channel conductances. Shaker is a low-conductance K-channel in which Pro475→Asp, a single-point mutation near the internal pore entrance, promotes 6- to 8-fold higher unitary current. To assess the mechanism for this higher conductance, we measured Shaker-P475D single-channel current in a wide range of symmetrical K(+) concentrations and voltages. Below 300 mM K(+), the current-to-voltage relations (i-V) showed inward rectification that disappeared at 1000 mM K(+). Single-channel conductance reached a maximum of ∼190 pS at saturating [K(+)], a value 4- to 5-fold larger than that estimated for the native channel. Intracellular Mg(2+) blocked this variant with ∼100-fold higher affinity. Near zero voltage, blockade was competitively antagonized by K(+); however, at voltages >100 mV, it was enhanced by K(+). This result is consistent with a lock-in effect in a single-file diffusion regime of Mg(2+) and K(+) along the pore. Molecular-dynamics simulations revealed higher K(+) density in the pore, especially near the Asp-475 side chains, as in the high-conductance MthK bacterial channel. The molecular dynamics also showed that K(+) ions bound distally can coexist with other K(+) or Mg(2+) in the cavity, supporting a lock-in mechanism. The maximal K(+) transport rate and higher occupancy could be due to a decrease in the electrostatic energy profile for K(+) throughout the pore, reducing the energy wells and barriers differentially by ∼0.7 and ∼2 kT, respectively.


Figures

Figure 1
Figure 1
Single-channel currents of Shaker-P475D. (A) Leak- and capacitance-subtracted single-channel traces elicited by voltage ramps between ±150 mV in symmetric 100 mM K-MES. The inside-out membrane patch was held at −90 mV and then stepped to −150 mV for 20 ms to begin with a 1 mV/ms ramp. The arrows indicate transitions between the two most common conductance states. (B) Current-voltage relations (i-V) constructed from unrestricted segmented averages of all open amplitudes (thin trace; see Materials and Methods). Data correspond to the average of open segments of at least 60 traces from the patch in A. For comparison, WT currents measured through voltage steps are shown by black circles. (C) Chord conductance of the trace average in B. The increment seen between −150 and −100 mV reflects the shift in dominance between the two most important conductance states. The solid line corresponds to a linear fit to the G-V curve in the ±50 mV interval. (D) Comparison between the average i-V restricted to the higher-conductance state of P475D (right ordinate; continuous trace) and the WT (left ordinate; open symbols) measured in identical ionic conditions.
Figure 2
Figure 2
i-V relationships at different symmetrical [K+]. (A) i-V relationships. The symbols are the mean (±SE) of unsmoothed averages taken every 10 mV (n = 3 for 50–500 mM and n = 2 for 1000 mM). For comparison, 21-point smoothed segmented averages of the higher-conductance open state are shown. (B) Near-zero voltage conductance as a function of [K+]. Conductances were computed near zero voltage as in Fig. 1C. The errors were smaller than the symbols. The solid line is a nonlinear fit of a Langmuir isotherm with half saturation at 47 ± 6 mM K+ and maximal conductance of 186 ± 4 pS.
Figure 3
Figure 3
Blockade by Mg2+of P475D. (A) Individual leak- and capacitance-subtracted single-channel traces in zero or 1 mM Mg2+ (two traces for each condition). Recording conditions as in Fig. 1. (B) i-V relations with 1 mM Mg2+ (asterisk) or no added Mg2+ in the indicated symmetric [K+]. In 50 mM K+, blockade is slightly voltage dependent, whereas at 500 mM it occurs mostly at positive voltages. (C) Zero-voltage conductance as a function of the [K+] measured in the presence of 1 mM Mg2+. Conductances (± SE, n = 3) were computed as in Fig. 1C. The solid line is a nonlinear fit of a Langmuir isotherm with half saturation at 283 ± 58 mM and maximum conductance of 201 ± 16 pS. The fit in the absence of Mg2+ in Fig. 2 is shown for comparison (dashed line).
Figure 4
Figure 4
Analysis of the inhibition by Mg2+of P475D. (A) Fractional unblocked current as a function of voltage; i/io ratios are the point-to-point quotient between the traces in the presence of Mg2+ and their respective traces in the absence of Mg2+. Solid lines are fits to Eq. 2 with parameters KBapp, the inhibition constant at zero voltage, and zδapp, the effective valence of the blockade. (B) KBapp versus [K+]. The continuous line is the linear fit to Eq. 3 for competitive inhibition with KB = 0.25 ± 0.24 mM and KK = 46.7 ± 4.5 mM. (C) app increases between 50 and 300 mM K+, but stabilizes near 0.38 at 1000 mM K+. The solid lines have no theoretical meaning.
Figure 5
Figure 5
Raising the internal ionic strength reduces P475D currents asymmetrically. (A) Traces recorded in the presence of 50 mM KMES (plus 1 mM MgCl2) external solution and 100 mM KMES internal solution. The thin trace was obtained with 100 mM sucrose added to the bath, and the thick trace was obtained with 50 mM NMDG-MES added to the bath. (B) Quotient trace between the higher- and lower-ionic-strength traces shows that the ionic strength reduced outward currents only. We obtained similar results in two other patches.
Figure 6
Figure 6
Modeled structure of the Shaker pore and K+ occupancy. (A) A snapshot of the P475D pore domain (residues 392–489) taken at ∼8 ns simulation time. Protein is shown in purple ribbons, K+ in green spheres, lipids in sticks, and Asp-475 in CPK. The front and back subunits were removed for clarity. The discontinuous lines schematize the 5 Å-radius pore-concentric cylinder in which time-averaged ion densities were calculated. The approximate locations of K+-binding sites are indicated by the arrows. Sites s5, s6, and s7 refer to positions aligning at z ∼ −7 Å, z ∼ −16 Å, and z ∼ −22 Å, respectively. (B and C) K+ density plot along the pore of WT and P475D, respectively. Plotted is the 10 ns time averaged ion density relative to the bulk density (110 mM K+) for a volume defined by every 0.5 Å slice along the 5 Å-radius cylinder. Insets: Representative pictures of distal occupancy of the pore.
Figure 7
Figure 7
Modeled occupancy by Mg2+ and K+ in P475D. Snapshots of the ions taken at ∼10 ns into the simulations (left) and average ion density plots (right). (A) Simulations beginning with the single dehydrated Mg2+ placed near the cavity site (Cavity). The divalent quickly acquired a fixed octahedral shell with six water molecules (33), and remained in the cavity in both simulations. The density plots were calculated as in Fig. 6. (B) Simulations beginning with the Mg2+ ion placed in the vicinity of the 475 side chain (475). Lipids, water molecules, and front and back subunits are not shown. Green and yellow spheres are K+ and Mg2+, respectively. The K+ density is relative to the bulk concentration (cyan distributions), whereas Mg2+ density (pink) is arbitrary because a single Mg2+ ion was used in the simulation.
Figure 8
Figure 8
Electrostatic potential at the Shaker pore. (A) To solve the PB equation, a dielectric constant of 80 was considered for the aqueous phase (zone I) and 2 for the protein and lipids (zone II). Asp-475 is represented in CPK space-filling mode. (B) Electrostatic potential, kT/eo, sensed by a charged probe along the pore axis (dashed and solid lines are WT and P475D, respectively). Within z = 13 Å and z = −1Å, the calculations are omitted. The thick black circles describe the difference in electrostatic potential between WT and P475D. (C and D) Electrostatic potential maps in pseudo colors for the WT and P475D structures, respectively. Blue is positive potential (>10 mV) and red is negative (<−10 mV). The α-carbon trace of the protein is shown as reference. The calculated plane cuts through the bilayer, the pore, and the water-filled vestibules.
Figure 9
Figure 9
Single-file regime for Mg2+ blockade of P475D. (A) Schematic representation of the single-file blockade scheme. Open and solid circles are K+ and Mg2+ ions, respectively. Equilibrium constants are described in the text. (B) Current inhibition as a function of the voltage at several K+ concentrations. The curves were drawn with the parameters obtained from a global fit of Eq. 5 to all data in Fig. 4A (see Materials and Methods). Parameters used: KKK = 43 mM; KK = 197 mM; KB = 0.56 mM; Ki = 0.00019; and KBK = 0.02 mM with zδ = 0.4.

Similar articles

Cited by

References

    1. Salkoff L., Wei A.D., Santi C.M. Potassium channels in C. elegans. WormBook. 2005;1:1–15. - PMC - PubMed
    1. Heginbotham L., Lu Z., MacKinnon R. Mutations in the K+ channel signature sequence. Biophys. J. 1994;66:1061–1067. - PMC - PubMed
    1. Lee S.Y., Banerjee A., MacKinnon R. Two separate interfaces between the voltage sensor and pore are required for the function of voltage-dependent K(+) channels. PLoS Biol. 2009;7:e47. - PMC - PubMed
    1. Carvacho I., Gonzalez W., Latorre R. Intrinsic electrostatic potential in the BK channel pore: role in determining single channel conductance and block. J. Gen. Physiol. 2008;131:147–161. - PMC - PubMed
    1. Brelidze T.I., Niu X., Magleby K.L. A ring of eight conserved negatively charged amino acids doubles the conductance of BK channels and prevents inward rectification. Proc. Natl. Acad. Sci. USA. 2003;100:9017–9022. - PMC - PubMed

Publication types

MeSH terms