Review
. 2013 May;16(5):824-40.
doi: 10.1017/S1368980012004077. Epub 2012 Sep 21.

Micronutrient intake and status in Central and Eastern Europe compared with other European countries, results from the EURRECA network

Affiliations
Review

Micronutrient intake and status in Central and Eastern Europe compared with other European countries, results from the EURRECA network

Romana Novaković et al. Public Health Nutr. 2013 May.

Abstract

Objective: To compare micronutrient intakes and status in Central and Eastern Europe (CEE) with those in other European countries and with reference values.

Design: Review of the micronutrient intake/status data from open access and grey literature sources from CEE.

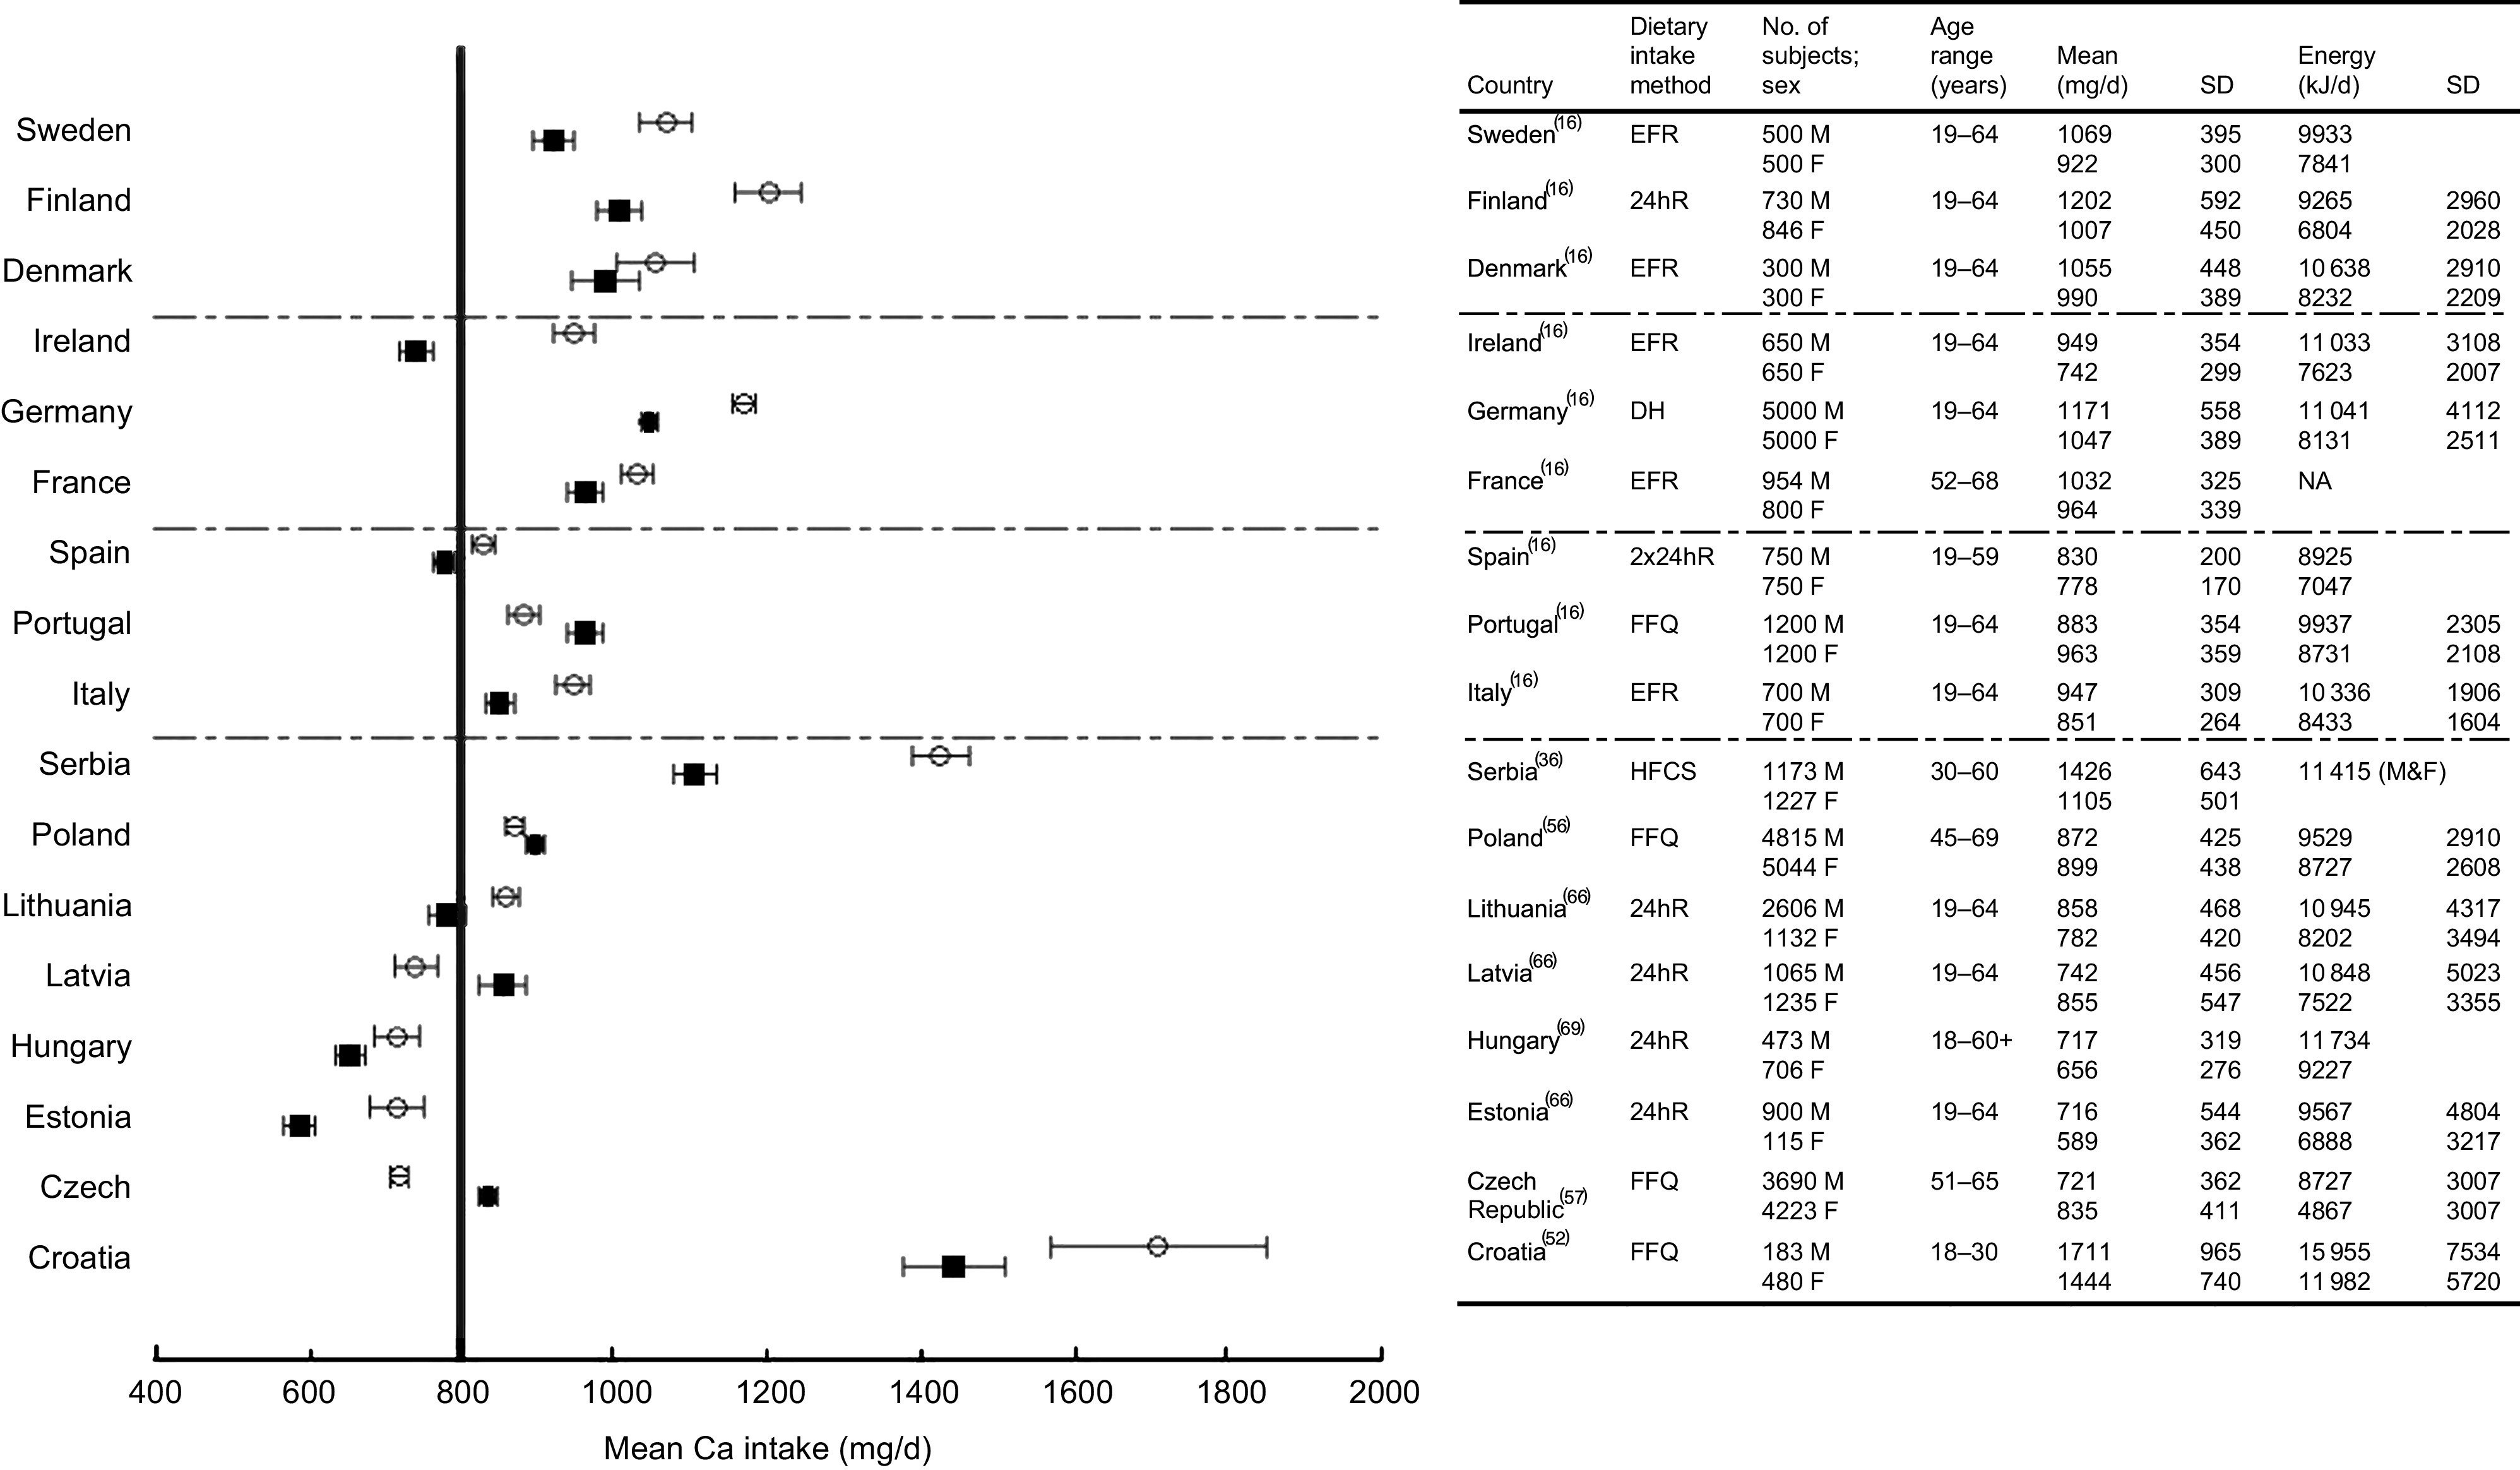
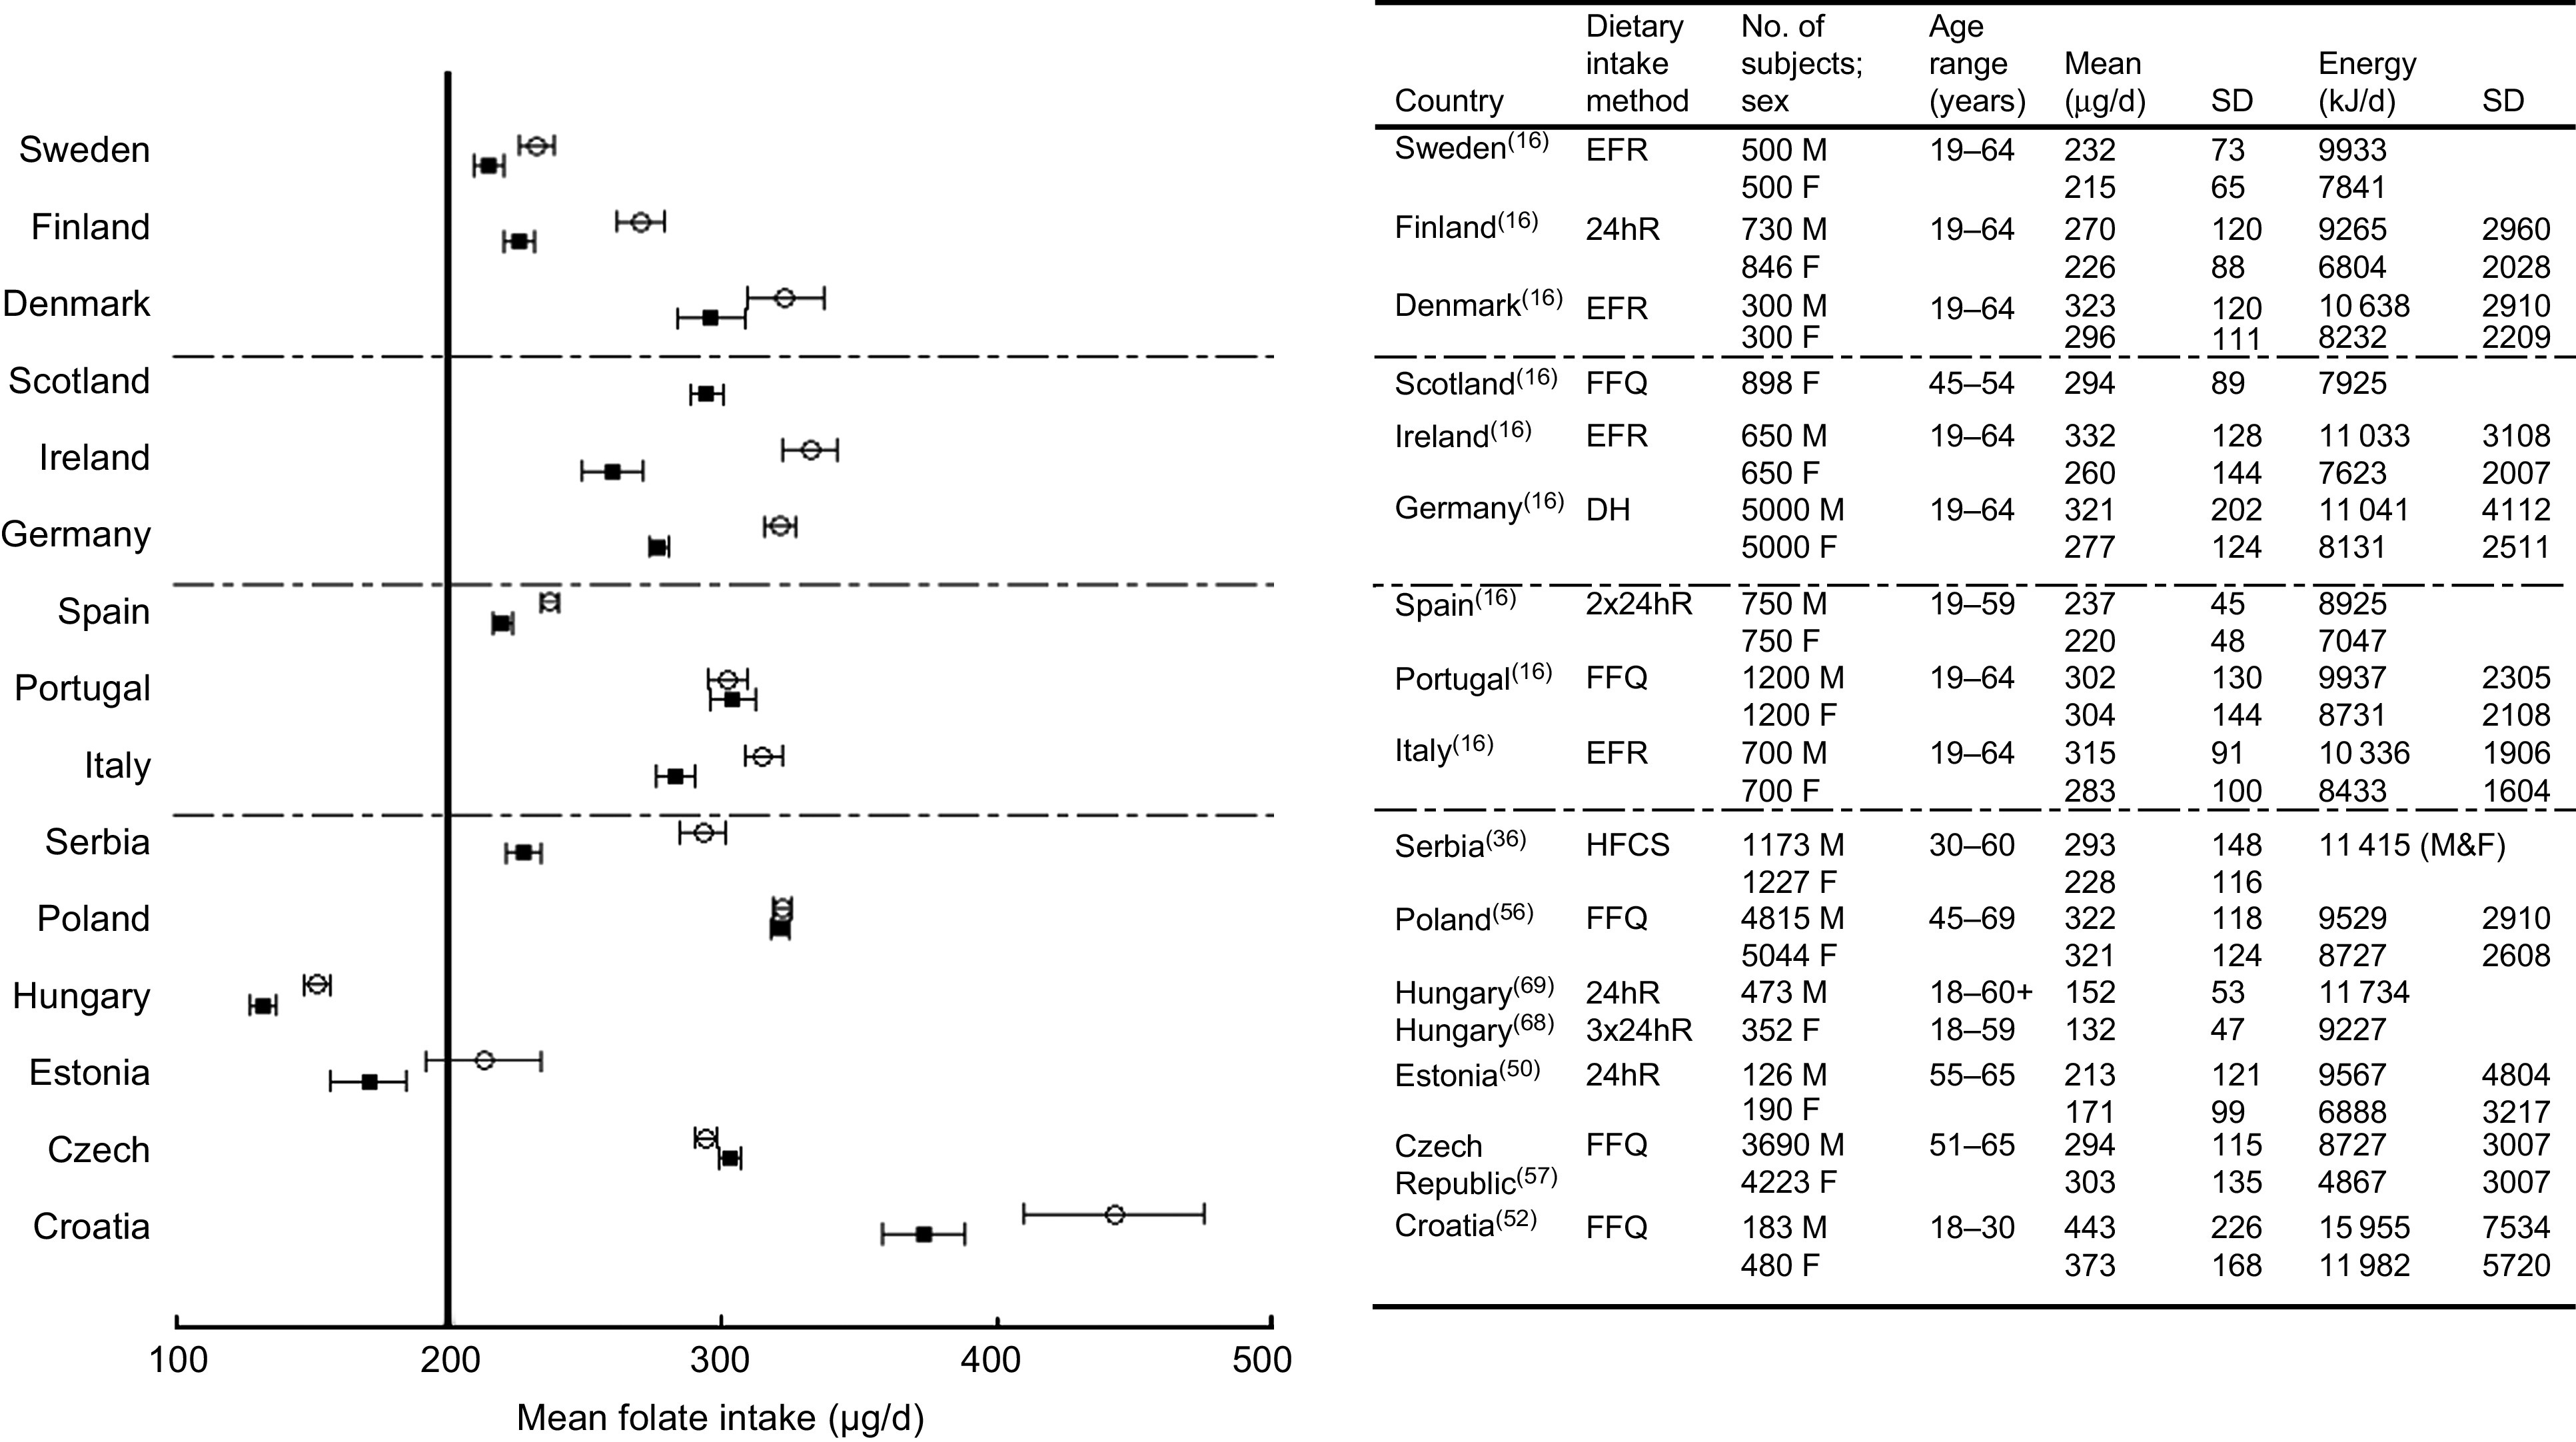
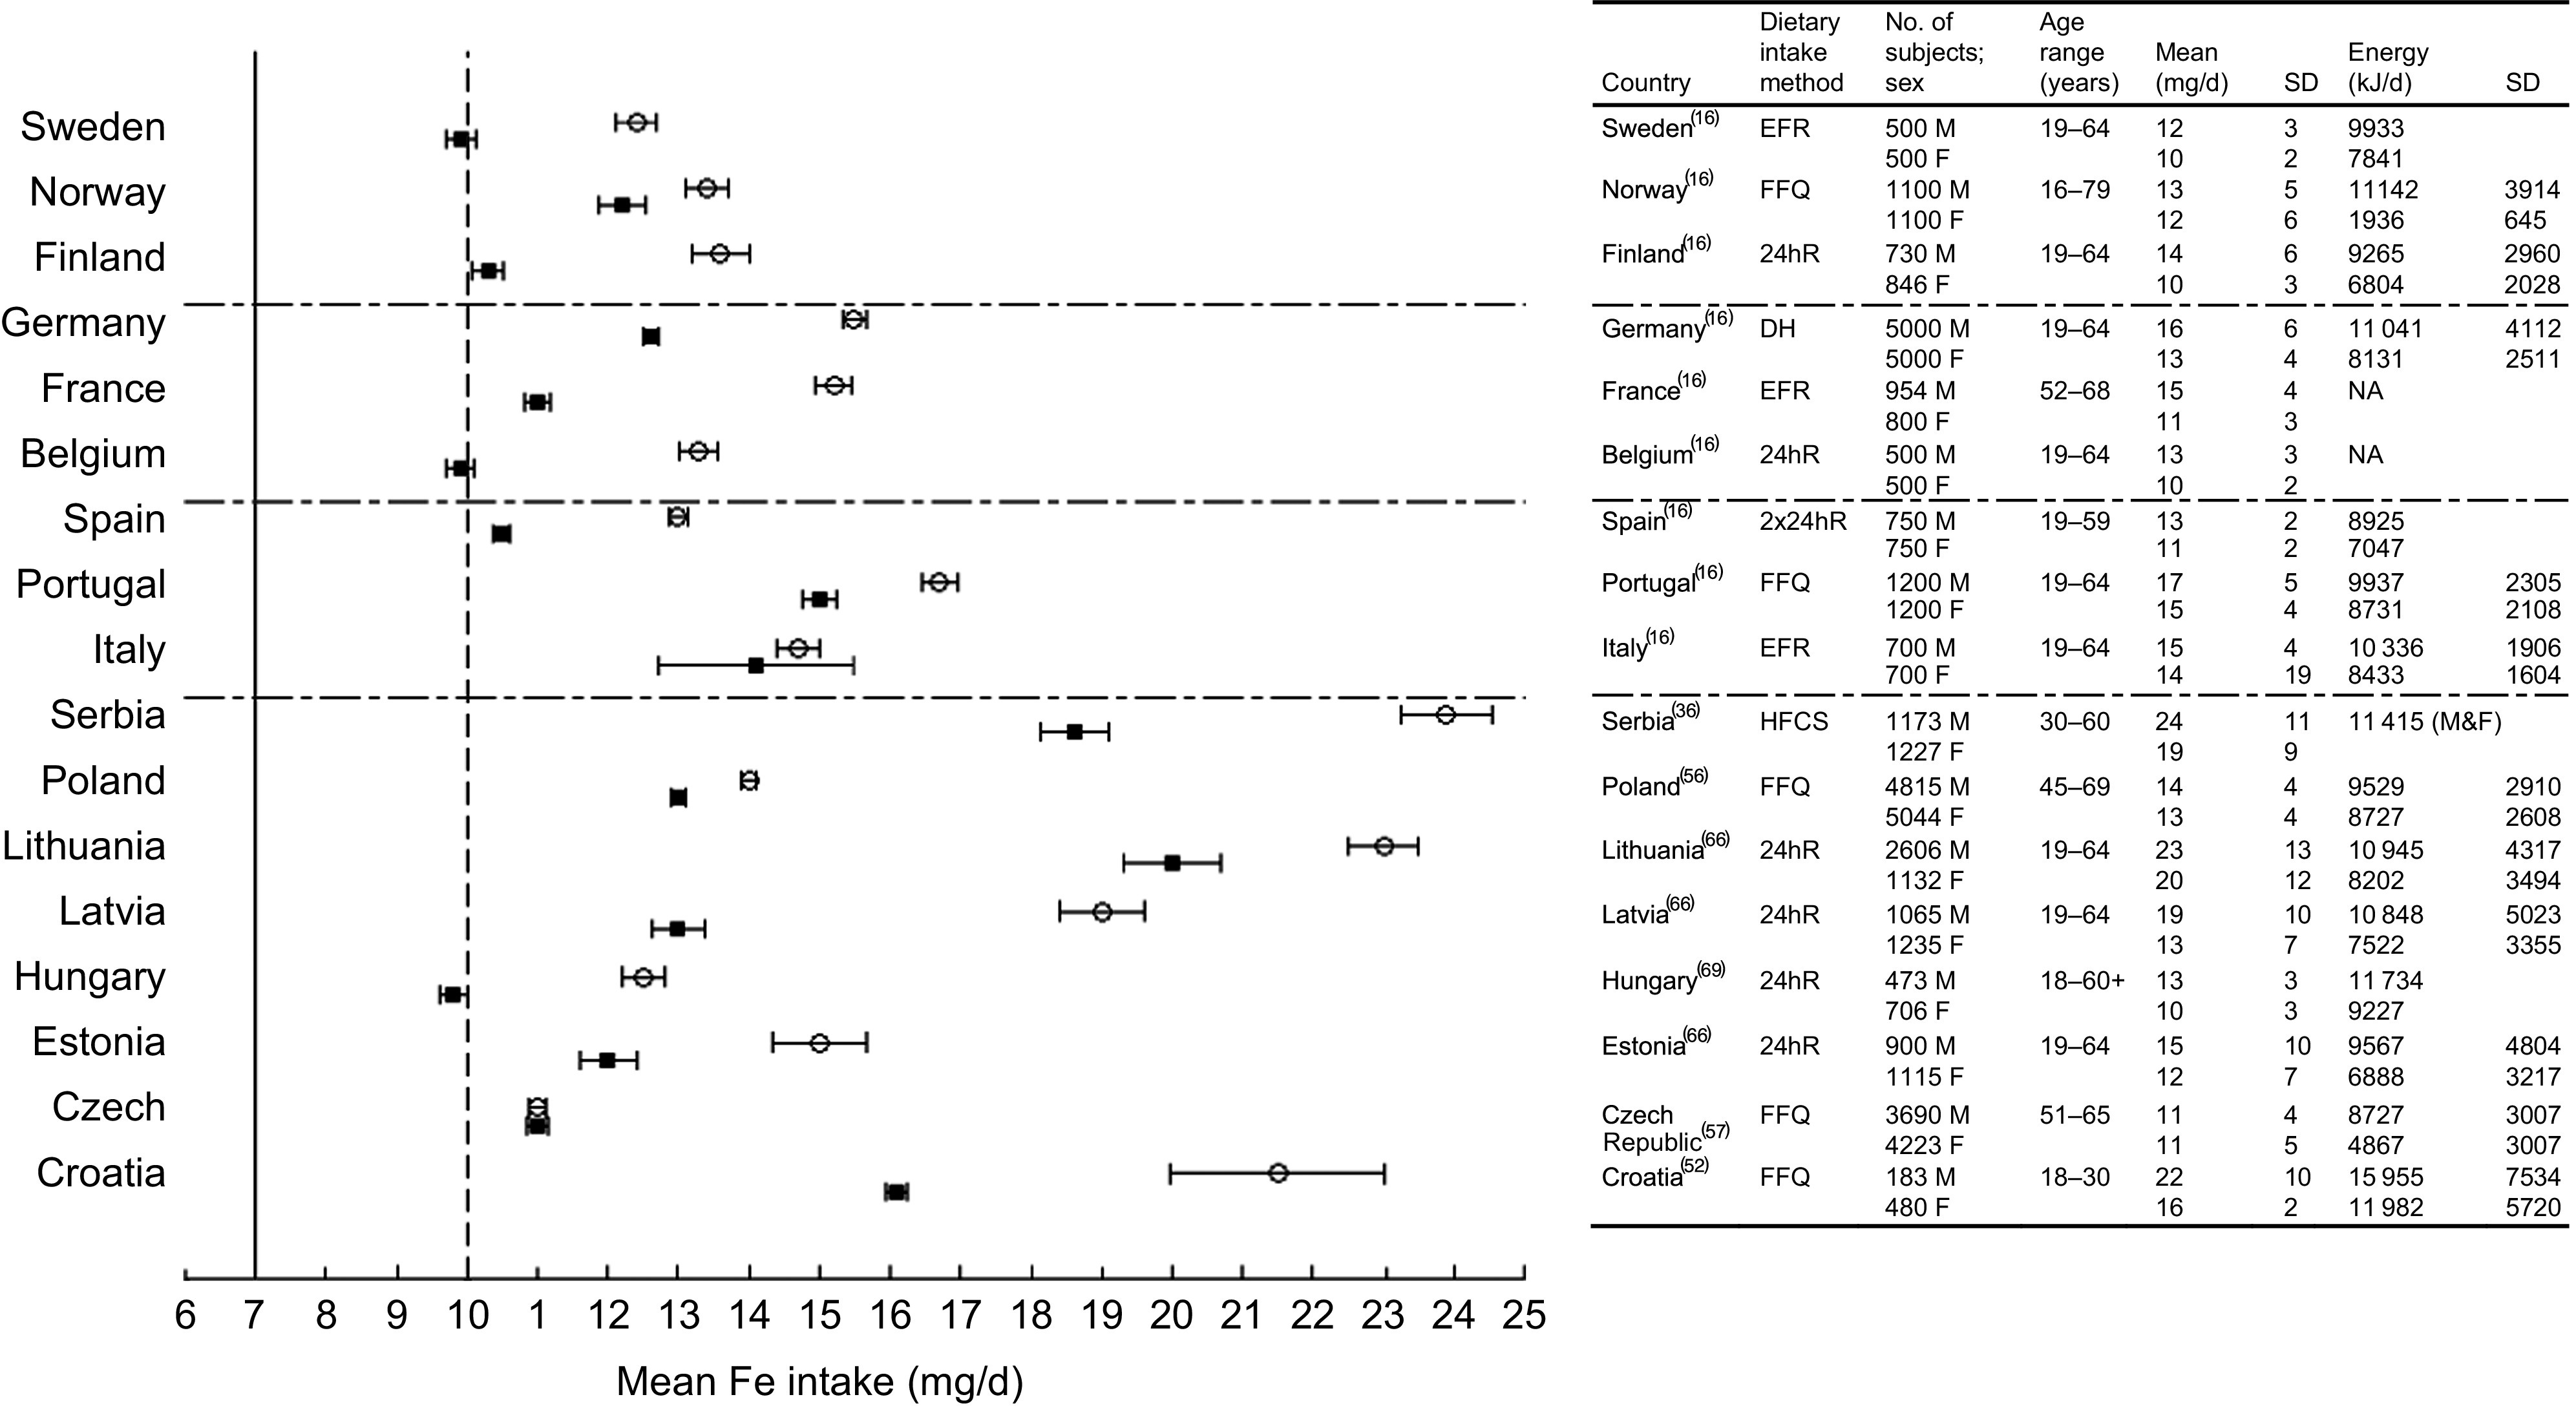
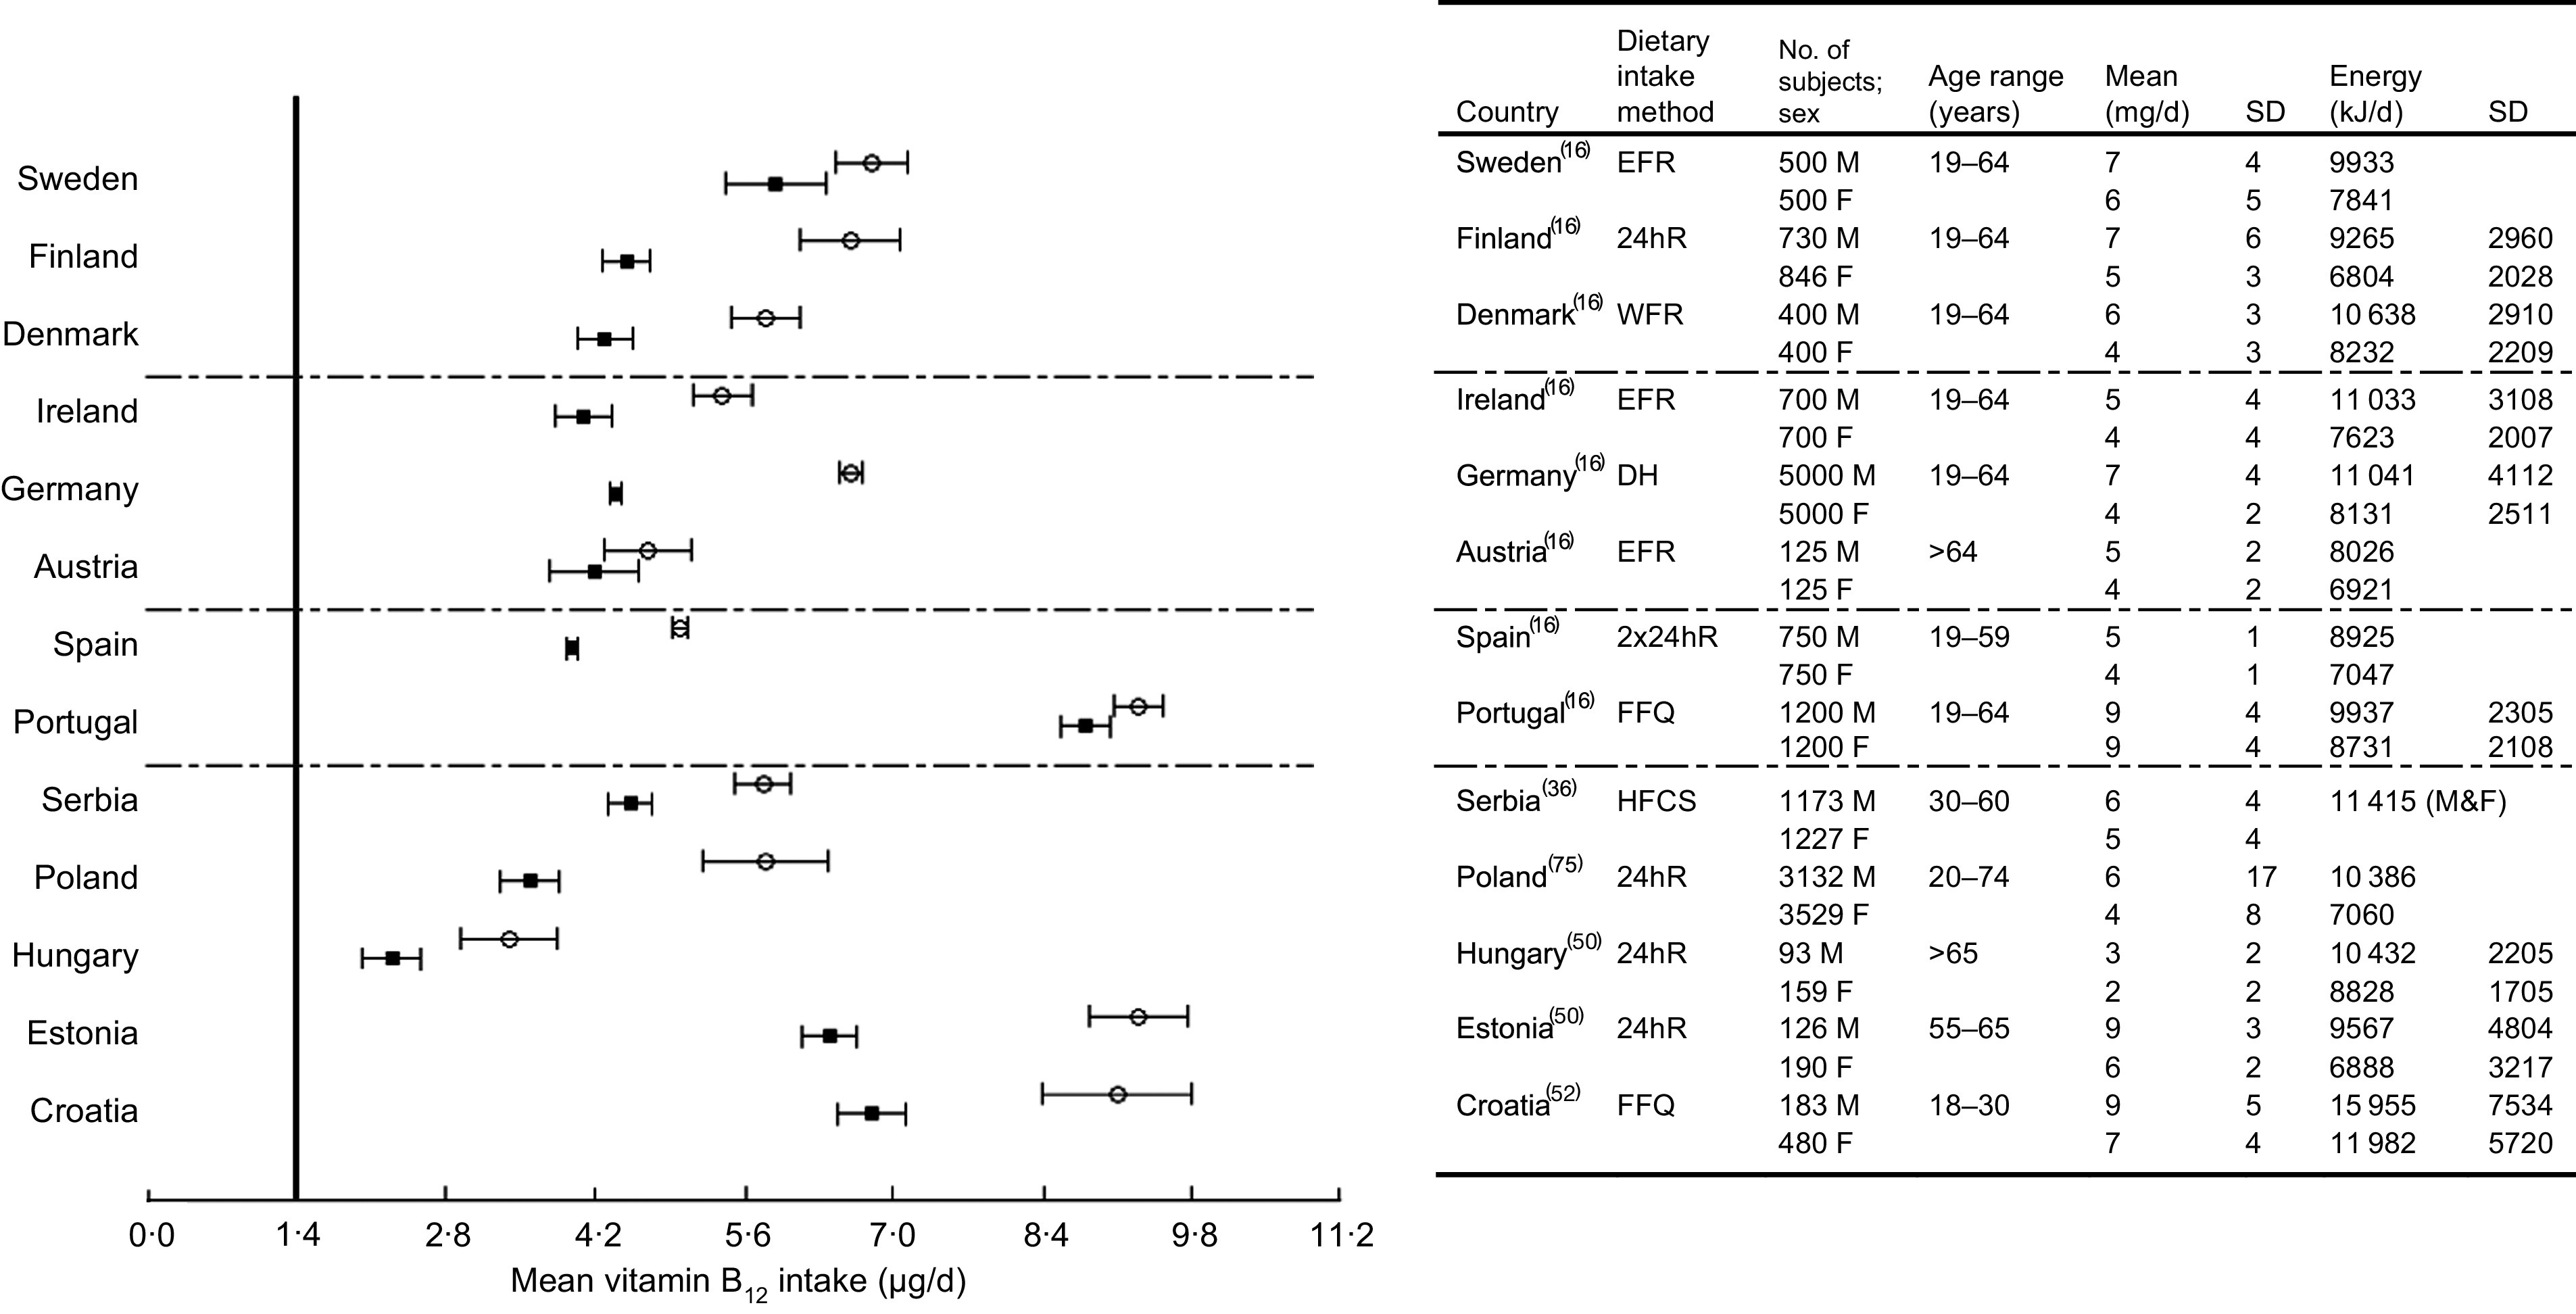
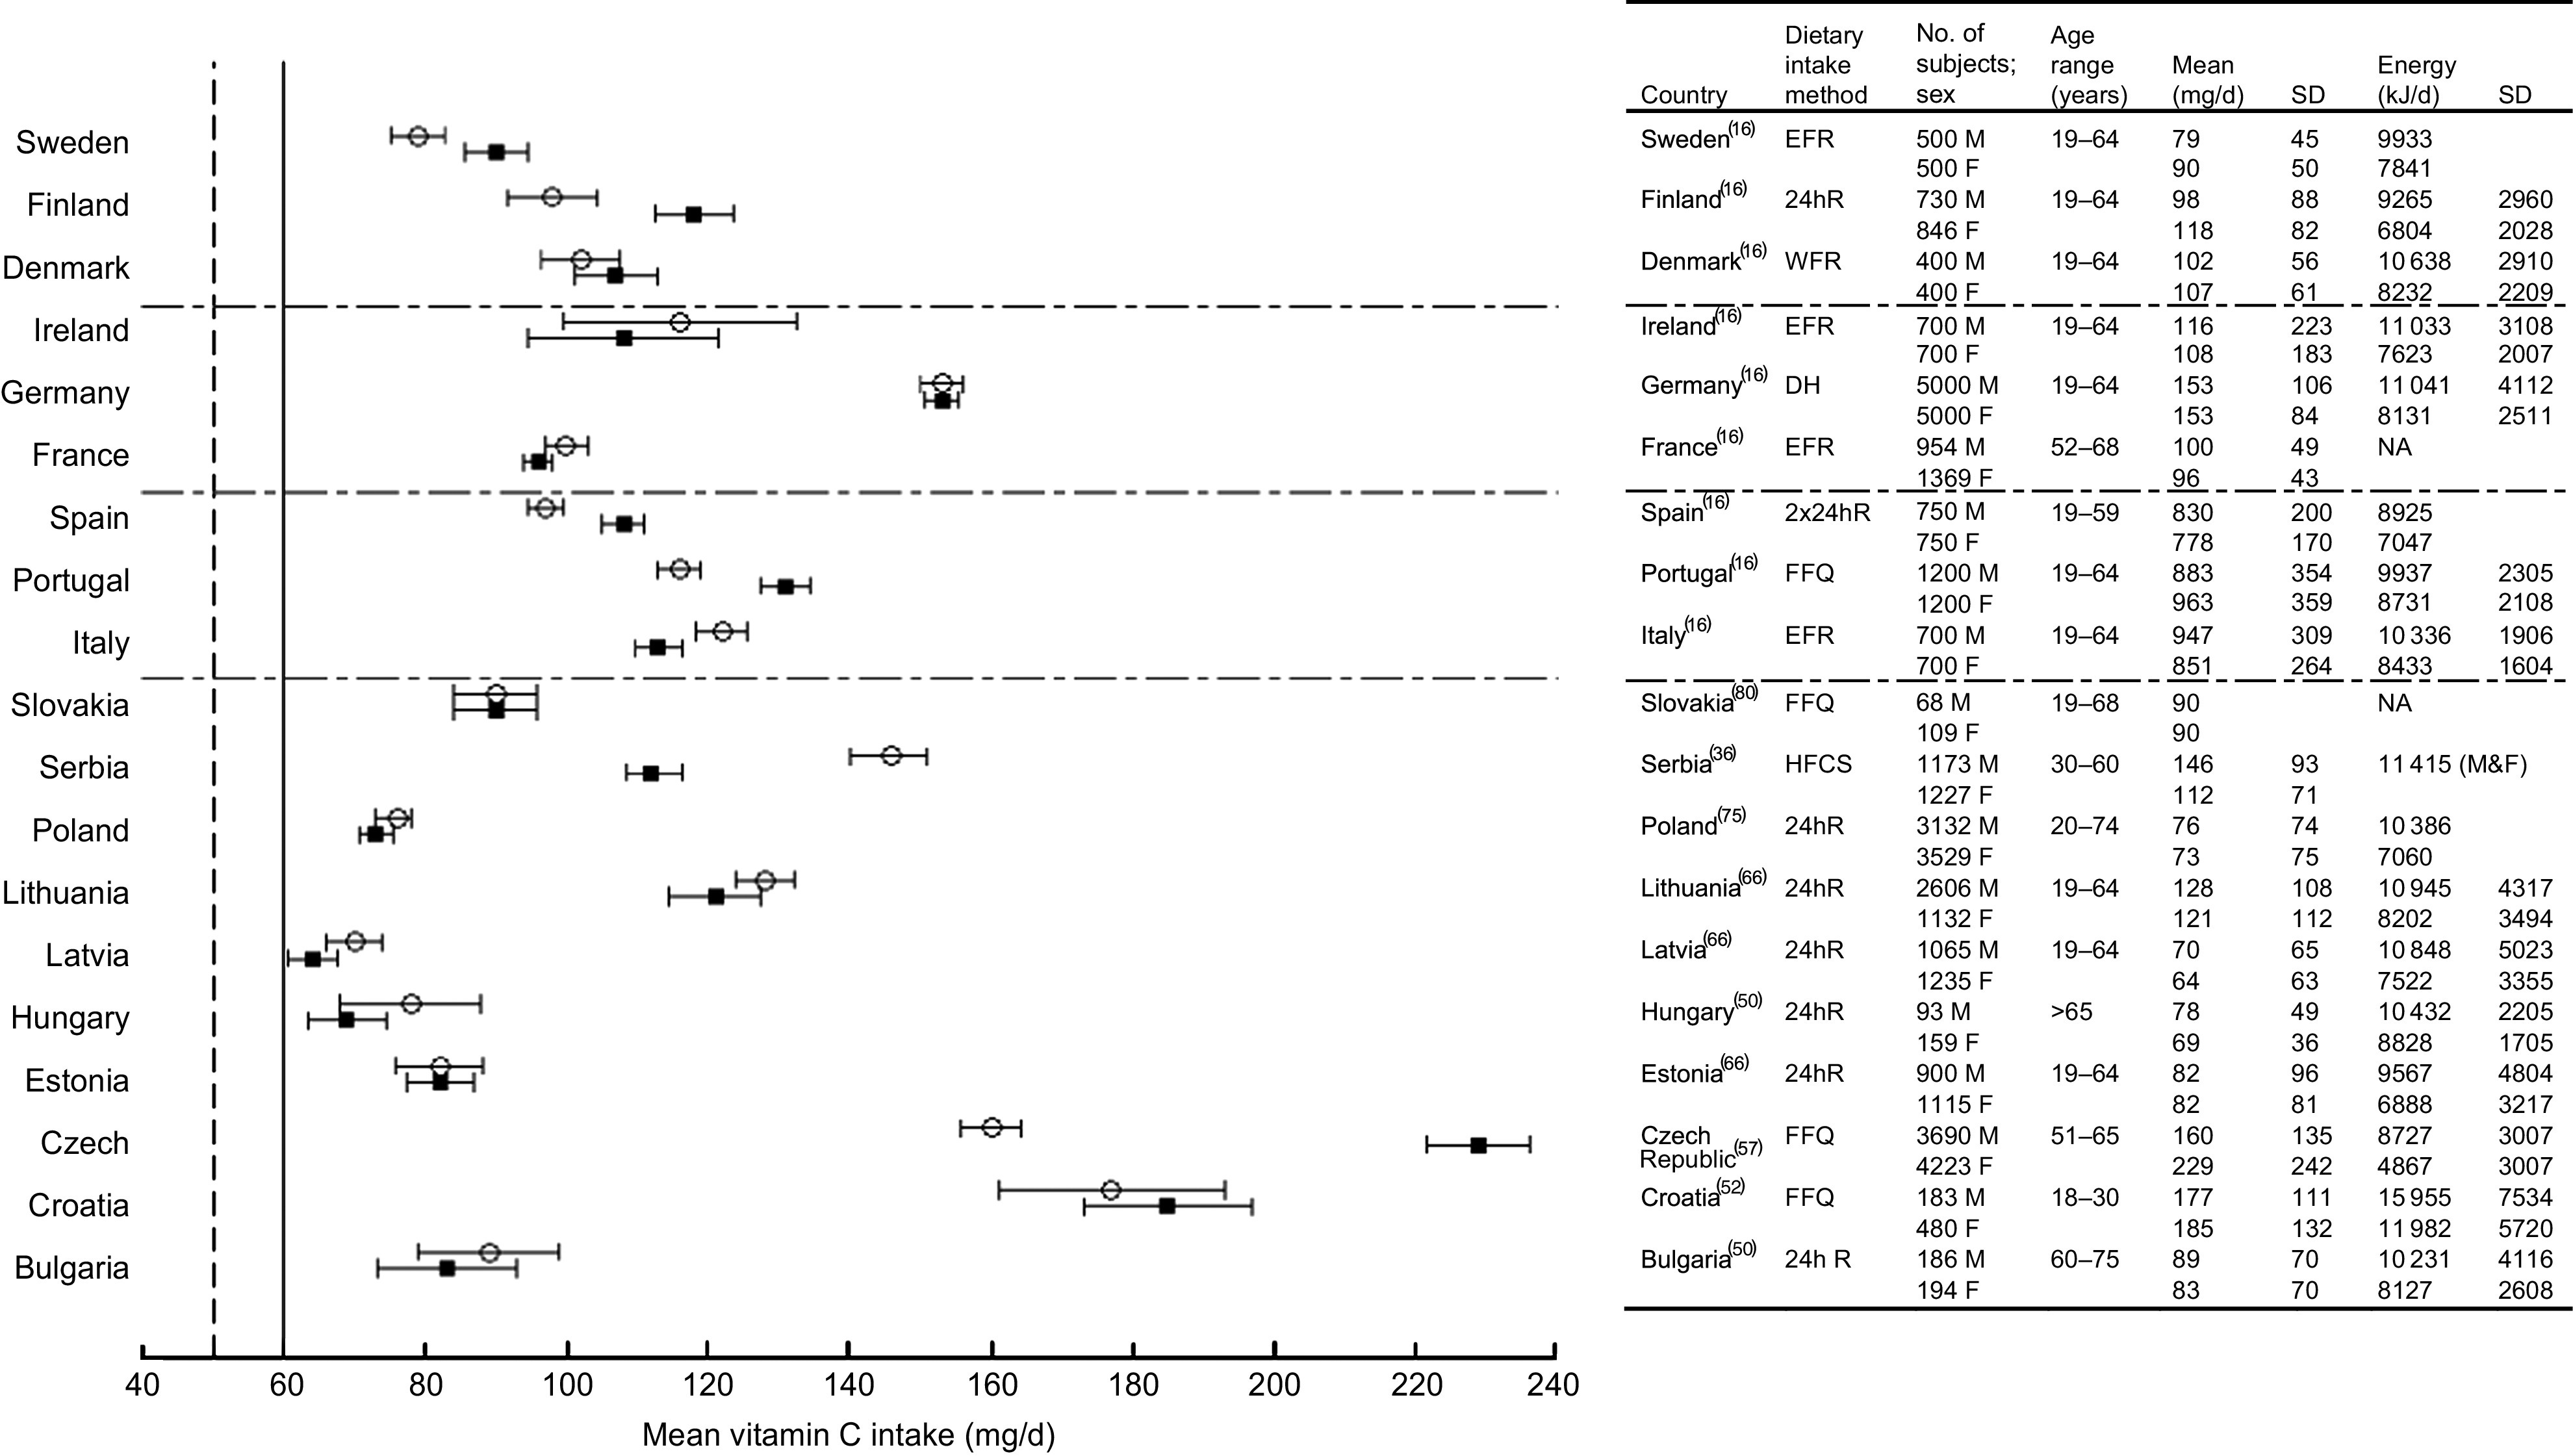
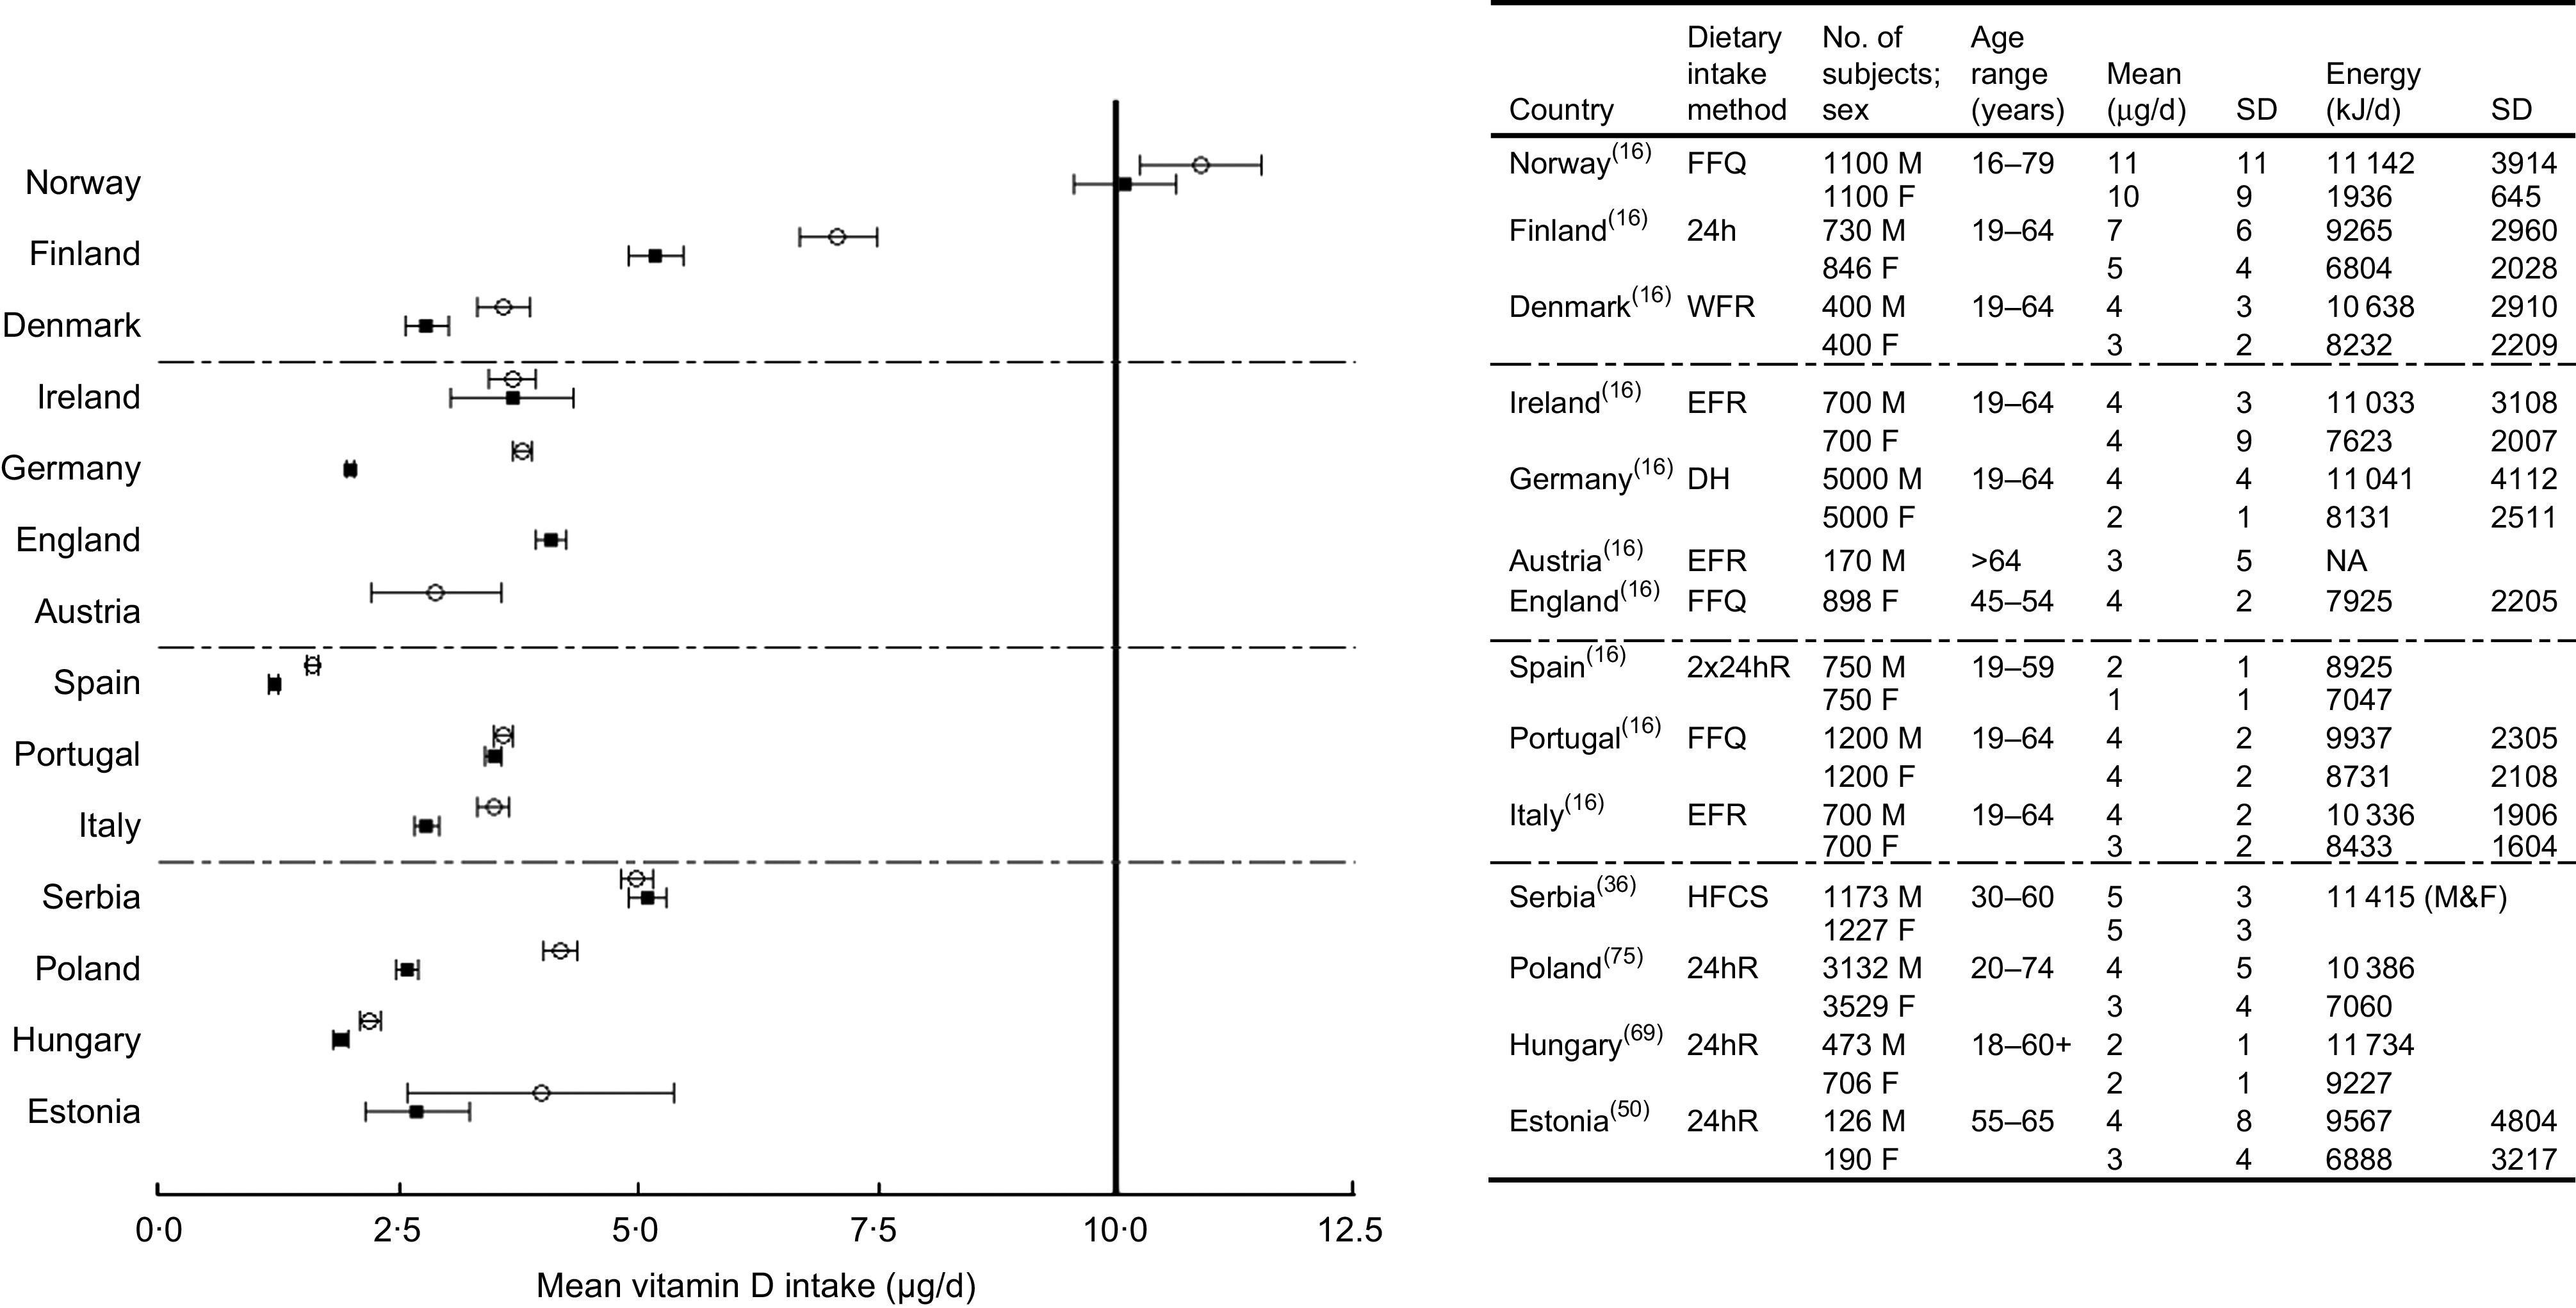
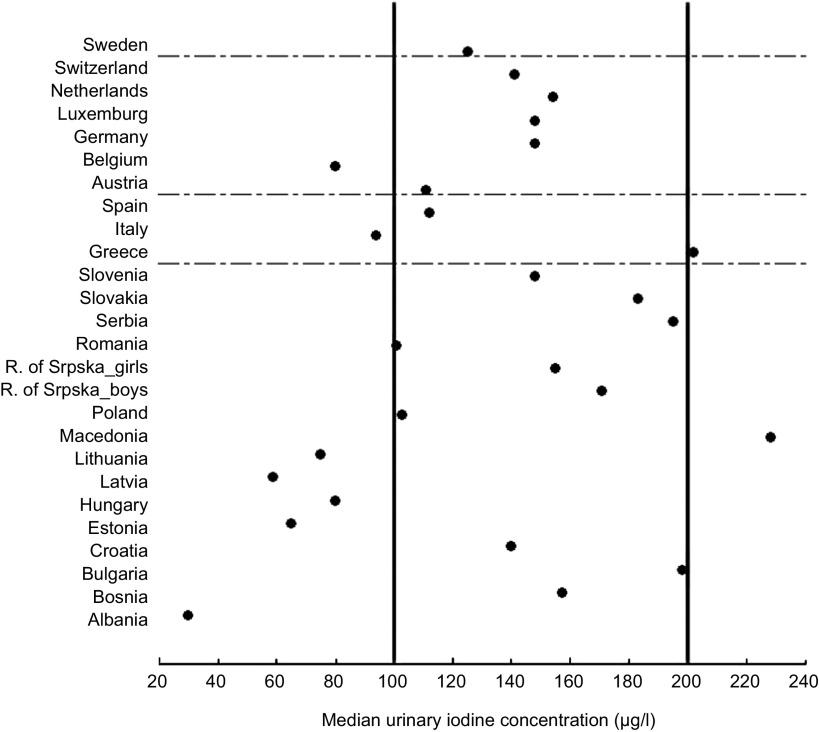
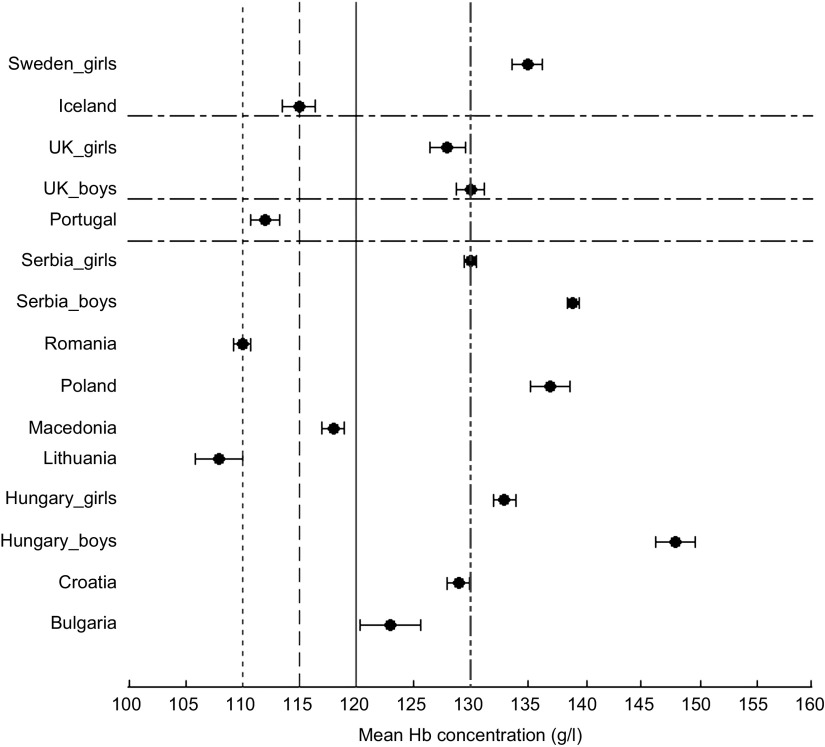
Setting: Micronutrients studied were folate, iodine, Fe, vitamin B12 and Zn (for intake and status) and Ca, Cu, Se, vitamin C and vitamin D (for intake). Intake data were based on validated dietary assessment methods; mean intakes were compared with average nutrient requirements set by the Nordic countries or the US Institute of Medicine. Nutritional status was assessed using the status biomarkers and cut-off levels recommended primarily by the WHO.

Subjects: For all population groups in CEE, the mean intake and mean/median status levels were compared between countries and regions: CEE, Scandinavia, Western Europe and Mediterranean.

Results: Mean micronutrient intakes of adults in the CEE region were in the same range as those from other European regions, with exception of Ca (lower in CEE). CEE children and adolescents had poorer iodine status, and intakes of Ca, folate and vitamin D were below the reference values.

Conclusions: CEE countries are lacking comparable studies on micronutrient intake/status across all age ranges, especially in children. Available evidence showed no differences in micronutrient intake/status in CEE populations in comparison with other European regions, except for Ca intake in adults and iodine and Fe status in children. The identified knowledge gaps urge further research on micronutrient intake/status of CEE populations to make a basis for evidence-based nutrition policy.


Figures

Fig. 1
Fig. 1
Mean (sd) calcium intake in mg/d and mean (sd) energy intake in kJ/d for males (M) and females (F) by country and region (separated at — - —, from top to bottom, into Scandinavia, Western Europe, Mediterranean and Central and Eastern Europe). Dietary intake method: EFR = estimated food record; 24hR = 24 h recall; DH = diet history; HFCS = household food consumption survey. NA = not available. Plot shows mean intakes with 95 % confidence intervals represented by horizontal bars: ○, males; ▪, females; ——, Average Nutrient Requirement (800 mg/d for females and males)
Fig. 2
Fig. 2
Mean (sd) folate intake in μg/d and mean (sd) energy intake in kJ/d for males (M) and females (F) by country and region (separated at — - —, from top to bottom, into Scandinavia, Western Europe, Mediterranean and Central and Eastern Europe). Dietary intake method: EFR = estimated food record; 24hR = 24 h recall; DH = diet history; HFCS = household food consumption survey. NA = not available. Plot shows mean intakes with 95 % confidence intervals represented by horizontal bars: ○, males; ▪, females; ——, Average Nutrient Requirement (200 μg/d for females and males)
Fig. 3
Fig. 3
Mean (sd) iron intake in mg/d and mean (sd) energy intake in kJ/d for males (M) and females (F) by country and region (separated at — - —, from top to bottom, into Scandinavia, Western Europe, Mediterranean and Central and Eastern Europe). Dietary intake method: EFR = estimated food record; 24hR = 24 h recall; DH = diet history; HFCS = household food consumption survey. NA = not available. Plot shows mean intakes with 95 % confidence intervals represented by horizontal bars: ○, males; ▪, females; ——, Average Nutrient Requirement (ANR; 7 mg/d for males); – – –, ANR (10 mg/d for females)
Fig. 4
Fig. 4
Mean (sd) vitamin B12 intake in μg/d and mean (sd) energy intake in kJ/d for males (M) and females (F) by country and region (separated at — - —, from top to bottom, into Scandinavia, Western Europe, Mediterranean and Central and Eastern Europe). Dietary intake method: EFR = estimated food record; 24hR = 24 h recall; WFR = weighed food record; DH = diet history; HFCS = household food consumption survey. NA = not available. Plot shows mean intakes with 95 % confidence intervals represented by horizontal bars: ○, males; ▪, females; ——, Average Nutrient Requirement (1.4 μg/d for females and males)
Fig. 5
Fig. 5
Mean (sd) vitamin C intake in mg/d and mean (sd) energy intake in kJ/d for males (M) and females (F) by country and region (separated at — - —, from top to bottom, into Scandinavia, Western Europe, Mediterranean and Central and Eastern Europe). Dietary intake method: EFR = estimated food record; 24hR = 24 h recall; WFR = weighed food record; DH = diet history; HFCS = household food consumption survey. NA = not available. Plot shows mean intakes with 95 % confidence intervals represented by horizontal bars: ○, males; ▪, females; ——, Average Nutrient Requirement (ANR; 60 mg/d for males); – – –, ANR (50 mg/d for females)
Fig. 6
Fig. 6
Mean (sd) vitamin D intake in μg/d and mean (sd) energy intake in kJ/d for males (M) and females (F) by country and region (separated at — - —, from top to bottom, into Scandinavia, Western Europe, Mediterranean and Central and Eastern Europe). Dietary intake method: EFR = estimated food record; 24hR = 24 h recall; WFR, weighed food record; DH = diet history; HFCS = household food consumption survey. NA = not available. Plot shows mean intakes with 95 % confidence intervals represented by horizontal bars: ○, males; ▪, females; ——, Average Nutrient Requirement (10 μg/d for females and males)
Fig. 7
Fig. 7
Median urinary iodine concentration in μg/l per d in children and adolescents by country and region (separated at — - —, from top to bottom, into Scandinavia, Western Europe, Mediterranean and Central and Eastern Europe). ——, Optimal range for median urinary iodine concentration (100–199 μg/l). Source of data: WHO Vitamin and Mineral Nutrition Information System, except for studies from Republic of Srpska( 82 ) and Serbia( 80 )
Fig. 8
Fig. 8
Mean Hb concentrations (with 95 % confidence intervals represented by horizontal bars) in g/l per d in children and adolescents by country and region (separated at — - —, from top to bottom, into Scandinavia, Western Europe, Mediterranean and Central and Eastern Europe). Age range of the subjects: Bulgaria 2–4 years; Croatia 7–8 years; Hungary 15–19 years; Lithuania 0·5–2 years; Macedonia 0·5–5 years; Poland 10–13 years; Romania 1 year; Serbia 15 years; Portugal 1 year; Iceland 1 year; UK 7–10 years; Sweden 15–16 years. Hb concentration below which anaemia is present: - - -, 110 g/l (children aged 0·5–5 years); – – –, 115 g/l (children aged 5–11 years); ——, 120 g/l (children aged 12–14 years and females aged >15 years); — - - —, 130 g/l (males aged >15 years). Source of data: WHO Vitamin and Mineral Nutrition Information System, except for study from Serbia( 36 )

Similar articles

Cited by

References

    1. World Health Organization (2008) Closing the Gap in a Generation: Health Equity Through Action on the Social Determinants of Health. Final Report of the Commission on Social Determinants of Health. Geneva: WHO. - PubMed
    1. Mackenbach JP, Kunst AE, Cavelaars AE et al. (1997) Socioeconomic inequalities in morbidity and mortality in western Europe. The EU Working Group on Socioeconomic Inequalities in Health. Lancet 349, 1655–1659. - PubMed
    1. James WP, Nelson M, Ralph A et al. (1997) Socioeconomic determinants of health. The contribution of nutrition to inequalities in health. BMJ 314, 1545–1549. - PMC - PubMed
    1. Darmon N (2008) Does social class predict diet quality? Am J Clin Nutr 87, 1107–1117. - PubMed
    1. Walters S & Suhrcke M (2005) Socioeconomic Inequalities in Health and Health Care Access in Central and Eastern Europe and the CIS: A Review of the Recent Literature. Working Paper 2005/1. Venice: WHO European Office for Investment for Health and Development.