. 2012 Nov 2;287(45):38265-78.
doi: 10.1074/jbc.M112.404707. Epub 2012 Sep 20.

Histone deacetylase inhibitor (HDACi) suberoylanilide hydroxamic acid (SAHA)-mediated correction of α1-antitrypsin deficiency

Affiliations

Histone deacetylase inhibitor (HDACi) suberoylanilide hydroxamic acid (SAHA)-mediated correction of α1-antitrypsin deficiency

Marion Bouchecareilh et al. J Biol Chem. .

Abstract

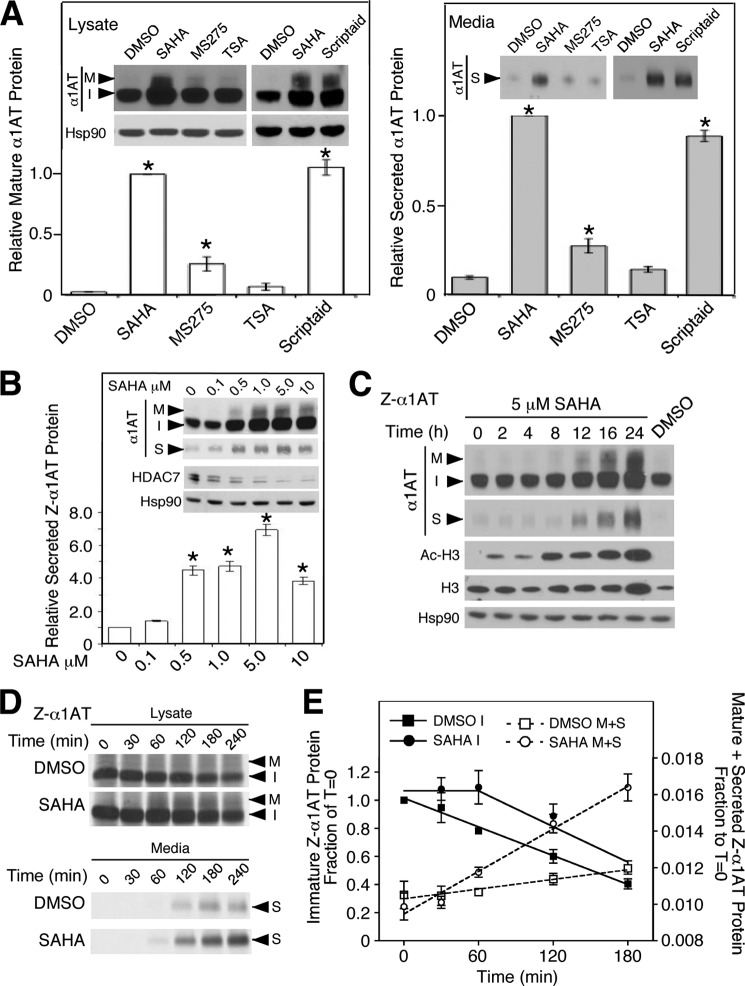
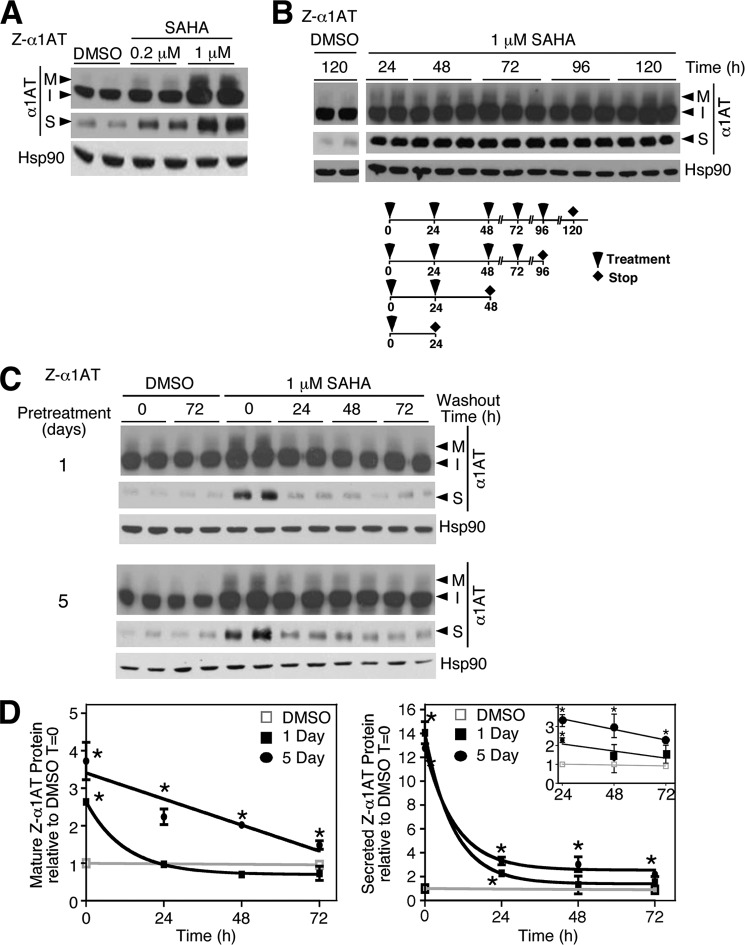
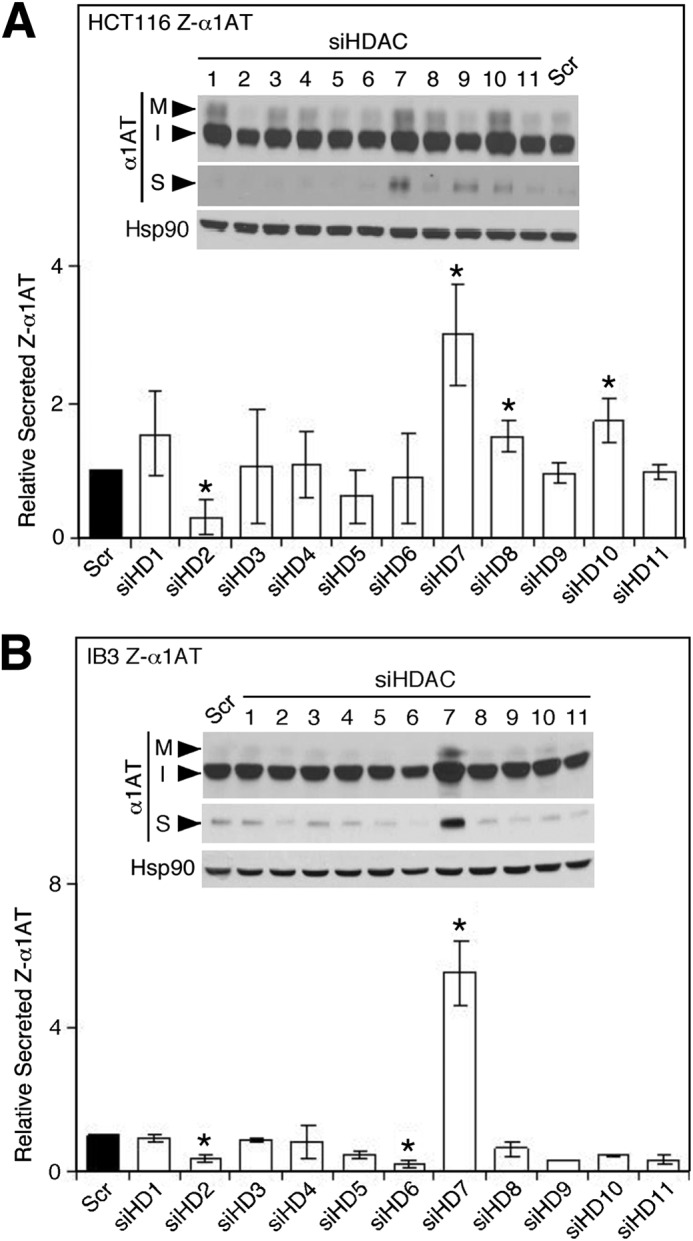
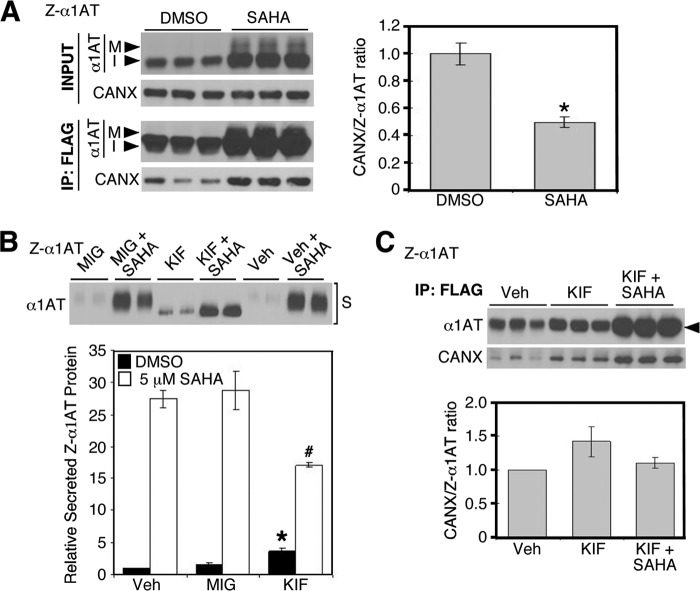
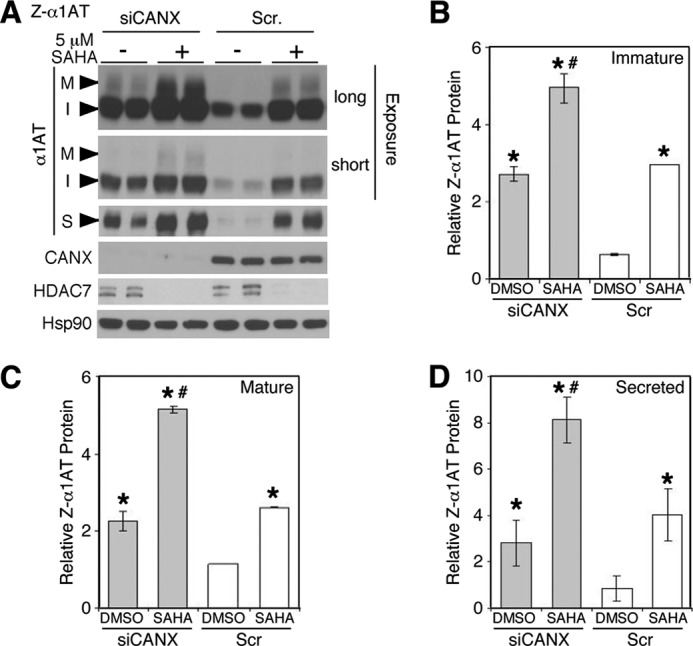
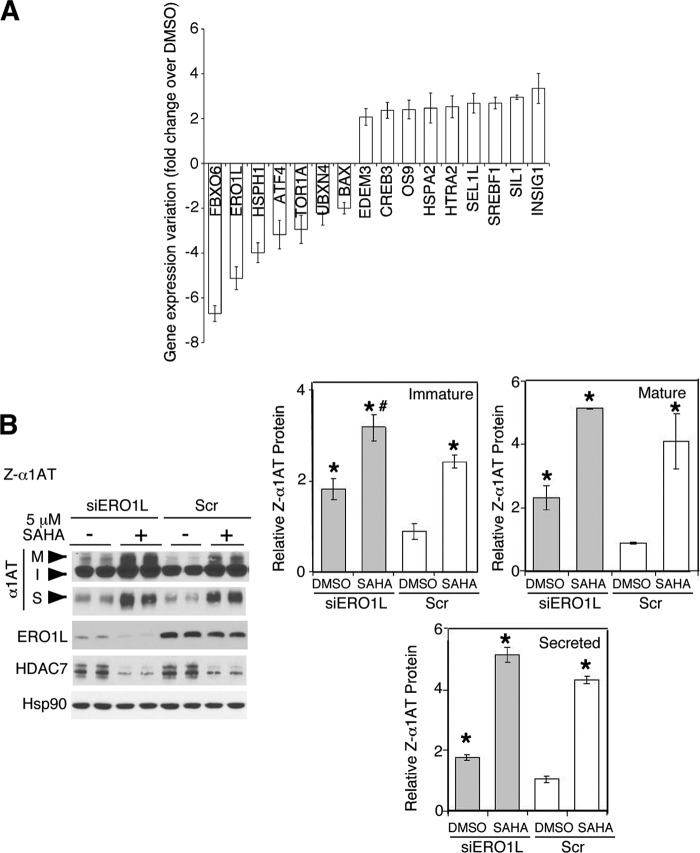
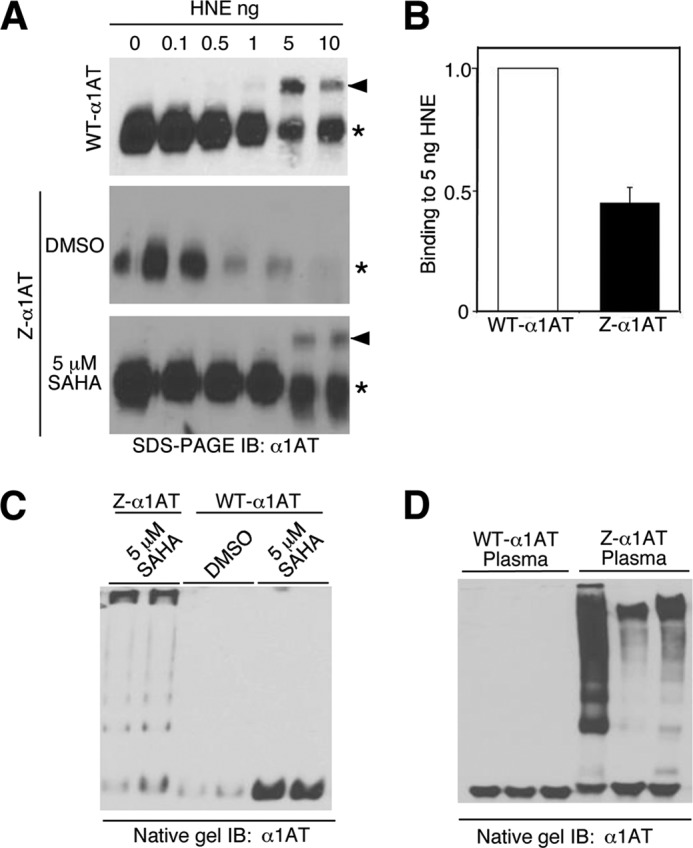
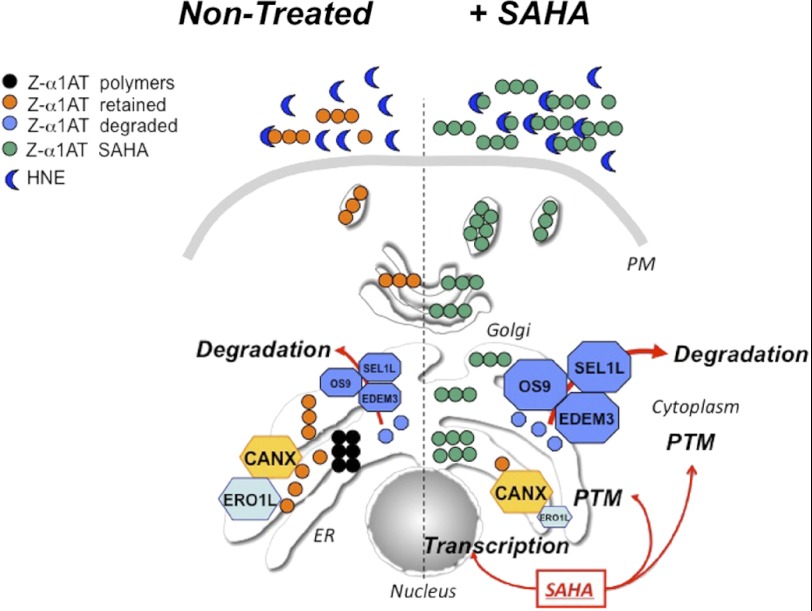
α1-Antitrypsin (α1AT) deficiency (α1ATD) is a consequence of defective folding, trafficking, and secretion of α1AT in response to a defect in its interaction with the endoplasmic reticulum proteostasis machineries. The most common and severe form of α1ATD is caused by the Z-variant and is characterized by the accumulation of α1AT polymers in the endoplasmic reticulum of the liver leading to a severe reduction (>85%) of α1AT in the serum and its anti-protease activity in the lung. In this organ α1AT is critical for ensuring tissue integrity by inhibiting neutrophil elastase, a protease that degrades elastin. Given the limited therapeutic options in α1ATD, a more detailed understanding of the folding and trafficking biology governing α1AT biogenesis and its response to small molecule regulators is required. Herein we report the correction of Z-α1AT secretion in response to treatment with the histone deacetylase (HDAC) inhibitor suberoylanilide hydroxamic acid (SAHA), acting in part through HDAC7 silencing and involving a calnexin-sensitive mechanism. SAHA-mediated correction restores Z-α1AT secretion and serpin activity to a level 50% that observed for wild-type α1AT. These data suggest that HDAC activity can influence Z-α1AT protein traffic and that SAHA may represent a potential therapeutic approach for α1ATD and other protein misfolding diseases.


Figures

FIGURE 1.
FIGURE 1.
Correction of Z-α1AT trafficking in response to SAHA treatment. A, immunoblot analysis of α1AT and Hsp90 protein expression from cell lysates (I, immature; M, mature) (left) and culture media (S, secreted) (right) after treatment of Z-HCT116 cells with 5 μm SAHA, 5 μm MS-275, 0.1 μm trichostatin A (TSA), 1 μm Scriptaid, and DMSO is shown. Quantitative analysis of the mature α1AT (left) and secreted α1AT (right) is shown (mean ± S.D., n = 3). B, immunoblot analysis of Z-α1AT, HDAC7, and Hsp90 protein expression from cell lysates and culture media after SAHA treatment of Z-HCT116 cells at the indicated concentration is shown. Quantitative analysis of the -fold increase in secreted Z-α1AT relative to DMSO treatment (0 μm) is shown (mean ± S.D., n = 3). C, immunoblot analysis of α1AT, acetylated (Ac-H3), and total histone H3 (H3), and Hsp90 protein expression after treatment of Z-HCT116 cells with 5 μm SAHA for the indicated time (h) is shown. D, pulse-chase analysis of Z-HCT116 cells after treatment with DMSO (top) or 5 μm SAHA (bottom) from cell lysates (upper) and culture media (lower) for the indicated chase time (min) is shown. E, quantitative analysis of the pulse-chase experiments in D for the immature (left axis, closed symbols) and combined mature and secreted (right axis, open symbols) forms of Z-α1AT after treatment with DMSO (squares) or 5 μm SAHA (circles) is shown. Data shown denote the -fold change relative to t = 0 (mean ± S.D., n = 2). In all panels asterisks indicate p < 0.05 as determined by two-tailed t test using DMSO as the reference.
FIGURE 2.
FIGURE 2.
Chronic low dose SAHA treatment sustains correction of Z-α1AT. A, Z-α1AT expression in cell lysates (I, immature; M, mature) (upper panel) and culture media (S, secreted) (middle panel) after a chronic, daily (every 24 h) treatment with DMSO, 0.2 or 1 μm SAHA for 120 h. B, immunoblot analysis of Z-α1AT protein expression in cell lysates (upper panel) and culture media (middle panel) after a chronic daily dosing scheme (below) of Z-HCT116 cells with 1 μm SAHA or DMSO for the indicated times (h). C, immunoblot analysis of Z-α1AT protein expression in cell lysates and culture media after a chronic daily pretreatment with 1 μm SAHA for 1 or 5 days and subsequent drug washout for the indicated time (h). D, quantitative analysis of the amount of mature (left) and secreted (right) forms of α1AT after a 1 (closed squares)- and 5-day (closed circles) pretreatment with 1 μm SAHA as in C. Data are plotted as the -fold change of α1AT relative to the 5-day DMSO treatment control (open squares) (mean ± S.D., n = 3). The inset in panel D (right) represents an enlargement of the 24–72-h washout period. The asterisk indicates p < 0.05 as determined by two-tailed t test using DMSO as the reference.
FIGURE 3.
FIGURE 3.
Silencing of HDAC7 corrects Z-α1AT maturation and secretion. Immunoblot analysis of Z-α1AT protein expression in cell lysates (upper panels: I, immature; M, mature) and culture media (middle panels: S, secreted) after siRNA-mediated silencing of HDACs 1–11 in Z-HCT116 cells (A) and Z-IB3 cells (B). Quantitative analysis of the level of secreted Z-α1AT in response to silencing of the indicated HDAC in Z-HCT116 (A) and Z-IB3 (B) cells. Data shown denote the -fold change in secreted Z-α1AT relative to scramble (Scr) control (mean ± S.D., n = 3). In all panels asterisks indicate p < 0.05 as determined by two-tailed t test using Scr control as the reference.
FIGURE 4.
FIGURE 4.
SAHA treatment alters calnexin binding to Z-α1AT. A, immunoblot and quantitative analyses of Z-α1AT and calnexin (CANX) from an immunoprecipitation (IP) of Z-α1AT from Z-HCT116 cells treated with DMSO or 5 μm SAHA for 24 h are shown. B, immunoblot and quantitative analyses of the level of secreted Z-α1AT after treatment of Z-HCT116 cells with 100 μm miglustat (MIG), 2 μg/ml kifunensine (KIF), or vehicle (Veh) for 24 h in the presence (white bars) or absence (black bars) of 5 μm SAHA. The data represent the -fold change relative to vehicle control (mean ± S.D., n ≥ 2). C, immunoblot and quantitative analyses of Z-α1AT and CANX from an immunoprecipitation of α1AT from Z-HCT116 cells treated with vehicle (Veh), 2 μg/ml kifunensine, or kifunensine + 5 μm SAHA for 24 h. The data in A and C are shown as a ratio of recovered calnexin to immature (I) Z-α1AT (mean ± S.D., n = 3) relative to DMSO. In all panels, # and * indicate p < 0.05 as determined by two-tailed t test using SAHA + vehicle (#) or vehicle (*) as the reference.
FIGURE 5.
FIGURE 5.
Calnexin silencing restores Z-αAT maturation and secretion. A, immunoblot analysis of Z-α1AT, CANX, and HDAC7 protein expression in cell lysates (M and I) and culture media (S) after siRNA-mediated calnexin silencing in the presence or absence of 5 μm SAHA in Z-HCT116 cells for 24 h. Two exposures are shown to highlight the separate effects of siCANX on the immature and mature bands. Quantitative analyses of the immature (B), mature (C), and secreted (D) forms of Z-α1AT after calnexin silencing (gray bar graph) relative to scrambled control (white bar graph) in the presence of a 5 μm SAHA or DMSO treatments of Z-HCT116 cells for 24 h. Data denote the -fold change in the protein expression of the indicated Z-α1AT form relative to DMSO + Scr control (mean ± S.D., n = 4). In all panels, the * and # indicate p < 0.05 as determined by two-tailed t test using DMSO + Scr (*) and SAHA + Scr (#) as reference, respectively.
FIGURE 6.
FIGURE 6.
Silencing of ERO1L restores Z-α1AT maturation and secretion. A, quantitative PCR analysis of the effect of a 5 μm SAHA treatment on the mRNA levels of 84 genes related to ER PN pathways in Z-HCT116 cells. The data are presented as -fold change in expression relative to DMSO treatment (mean ± S.D., n = 3), and genes with a statistically significant difference in expression (p < 0.05), as determined by Student's t test, are shown. B, immunoblot analysis of Z-α1AT, ERO1L, and HDAC7 protein expression in cells extracts and culture media (S) after the silencing of ERO1L (siERO1L) in the presence or absence of 5 μm SAHA in Z-HCT116 cells for 24 h. Quantitative analysis of the effect of ERO1L silencing (gray bar) on the immature, mature, and secreted forms of Z-α1AT relative to Scr control (white bar) in the presence of 5 μm SAHA or DMSO treatments of Z-HCT116 cells for 24 h is shown. Data are presented as -fold change in the expression of the indicated Z-α1AT form relative to DMSO + Scr control (mean ± S.D., n = 4). In all panels, the * and # indicate p < 0.05 as determined by two-tailed t test using DMSO + Scr (*) and SAHA + Scr (#) as reference.
FIGURE 7.
FIGURE 7.
Effect of SAHA on Z-α1AT activity. A, immunoblot (IB) analysis of α1AT after incubation of HNE with secreted WT (top) or Z-α1AT from HCT116 cells treated with DMSO (middle) or 5 μm SAHA (bottom) for 24 h. Supershift of α1AT (arrowhead) relative to secreted α1AT (asterisk) indicates the presence of SDS-resistant complexes with HNE. B, quantitative analysis of -fold change in the amount of secreted α1AT bound to 5 ng of HNE for WT-α1AT and Z-α1AT after treatment with 5 μm SAHA (black) (mean ± S.D., n = 3). C, native gel analysis of secreted Z-α1AT and WT-α1AT after the treatment of HCT116 cells with DMSO or 5 μm SAHA for 24 h. D, native gel analysis of plasma samples from three individuals wild-type (WT-α1AT) and Z-variant (Z-α1AT) patients.
FIGURE 8.
FIGURE 8.
A model for SAHA mediated effects on α1AT folding and trafficking. In non-treated conditions (left panel) Z-α1AT can be recovered in 4 pools. These include: 1) the pool being actively managed through the calnexin cycle (orange circles); 2) the major (>85%) pool targeted for degradation by the ERAD pathway (including its links to EDEM3-OS9-SEL1L) after hand-off from calnexin (blue circles); 3) a minor but cumulative toxic aggregated pool triggering liver disease (clustered black circles) (, , –106); 4), an inefficiently secreted but partially active polymeric Z-α1AT pool that can be found in serum of Z-variant patients (clustered orange circles in Golgi and extracellular pools) (107). After SAHA treatment (right panel), we suggest that Z-α1AT is redistributed between the various pools to promote export. We observe a decrease in the ER retained Z-α1AT accompanied by an increase in the ERAD pathway as well as increased secretion of a functional form Z-α1AT (green circles). We suggest that the HDACi SAHA promotes remodeling of the ER proteostasis network either transcriptionally and/or post-translationally (PTM) to partially restore the secretion of functional Z-α1AT.

Similar articles

Cited by

References

    1. Balch W. E., Morimoto R. I., Dillin A., Kelly J. W. (2008) Adapting proteostasis for disease intervention. Science 319, 916–919 - PubMed
    1. Bouchecareilh M., Balch W. E. (2011) Proteostasis. A new therapeutic paradigm for pulmonary disease. Proc. Am. Thorac. Soc. 8, 189–195 - PMC - PubMed
    1. Hutt D., Balch W. E. (2010) Cell Biology. The proteome in balance. Science 329, 766–767 - PMC - PubMed
    1. Powers E. T., Morimoto R. I., Dillin A., Kelly J. W., Balch W. E. (2009) Biological and chemical approaches to diseases of proteostasis deficiency. Annu. Rev. Biochem. 78, 959–991 - PubMed
    1. Ong D. S., Kelly J. W. (2011) Chemical and/or biological therapeutic strategies to ameliorate protein misfolding diseases. Curr. Opin. Cell Biol. 23, 231–238 - PMC - PubMed

Publication types

MeSH terms