Review
. 2013 Jan:32:1-21.
doi: 10.1016/j.preteyeres.2012.08.003. Epub 2012 Sep 17.

Glaucomatous damage of the macula

Affiliations
Review

Glaucomatous damage of the macula

Donald C Hood et al. Prog Retin Eye Res. 2013 Jan.

Abstract

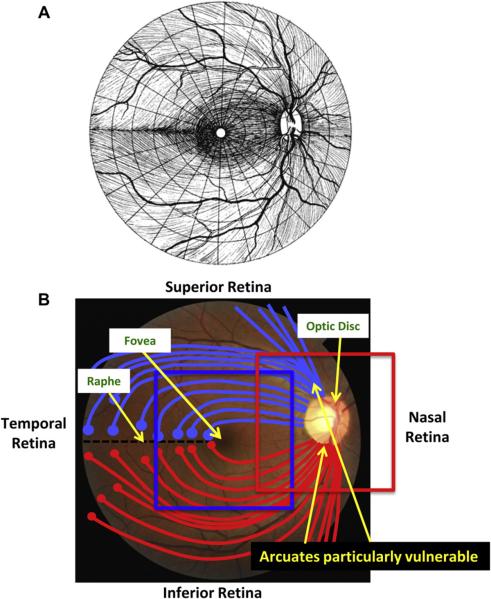
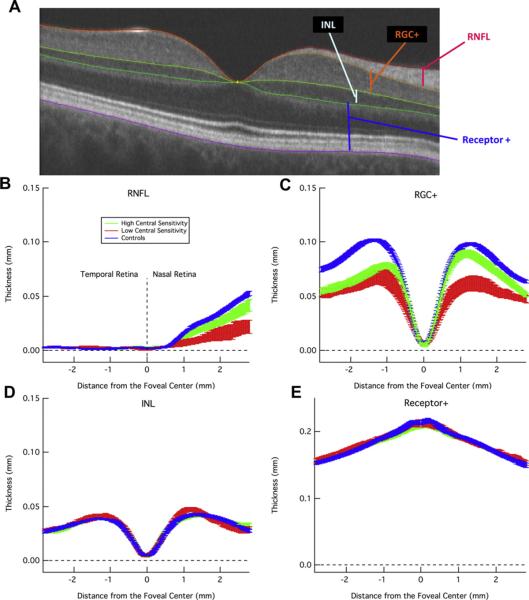
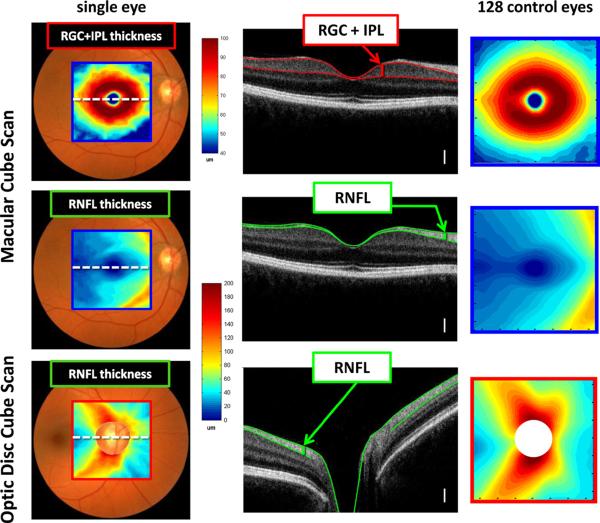
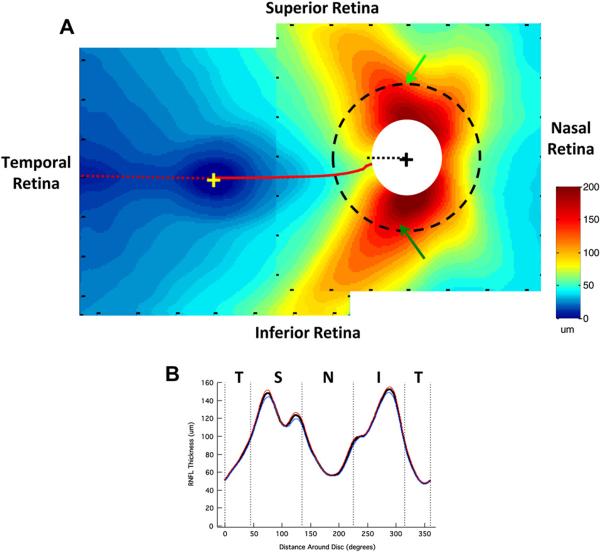
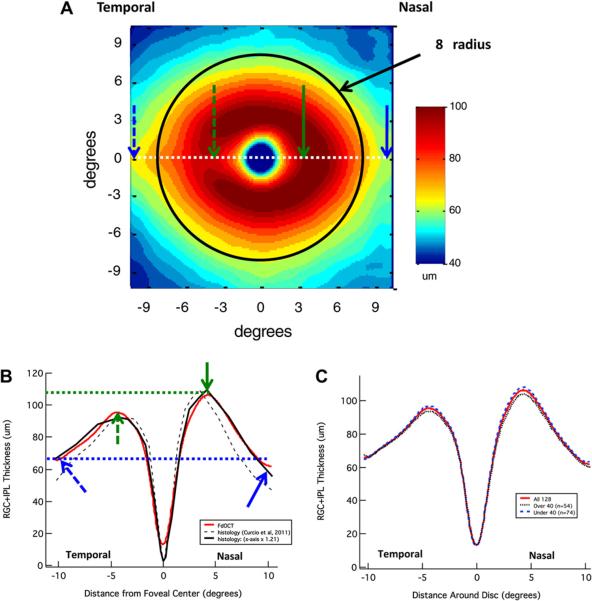
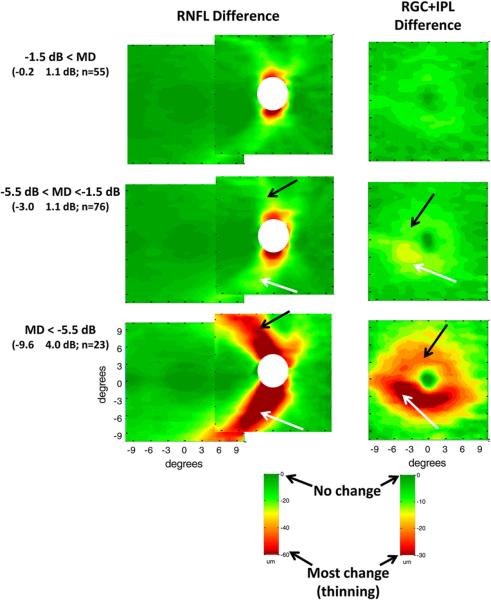
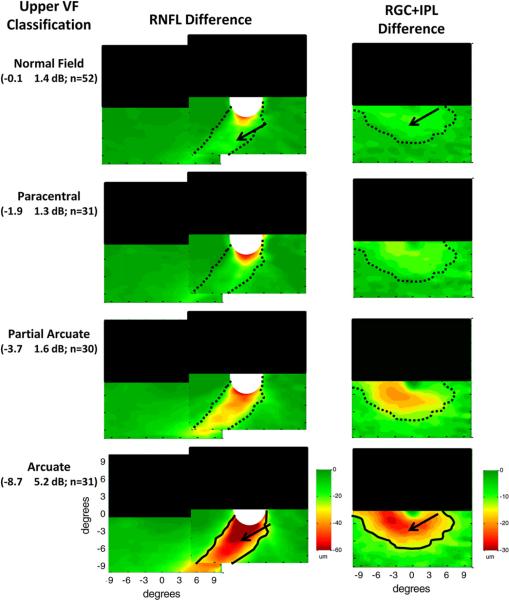
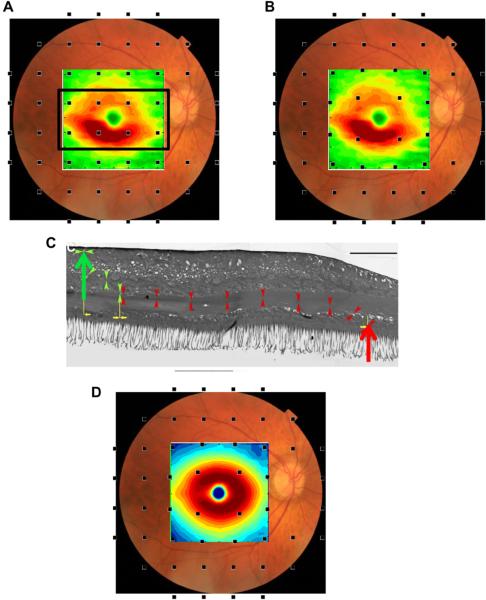
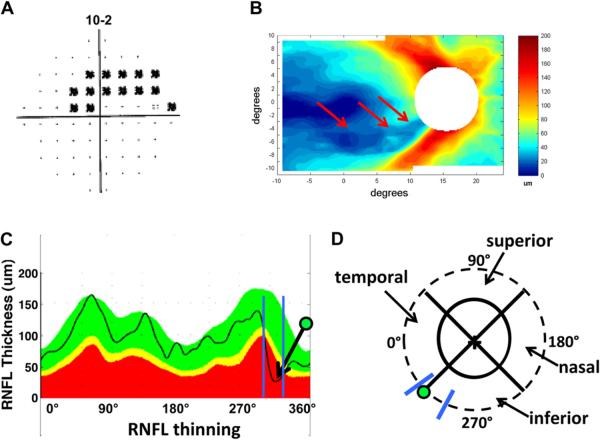
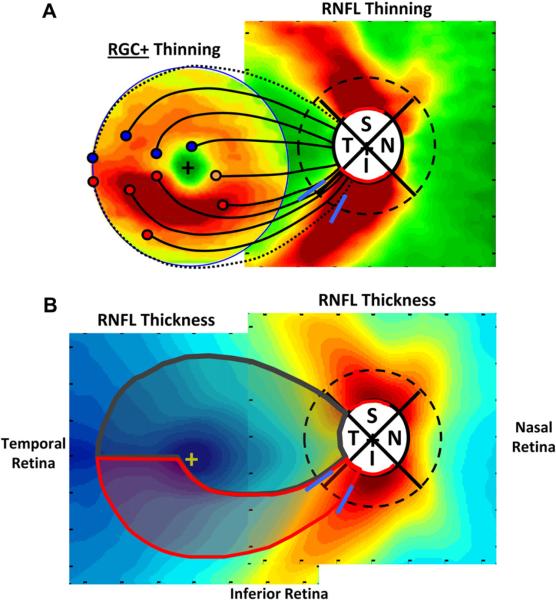
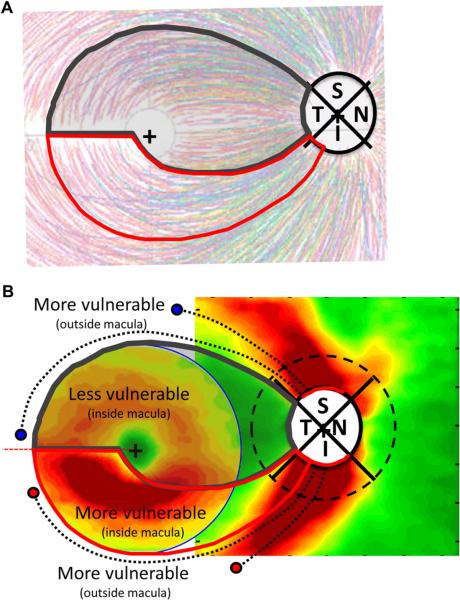
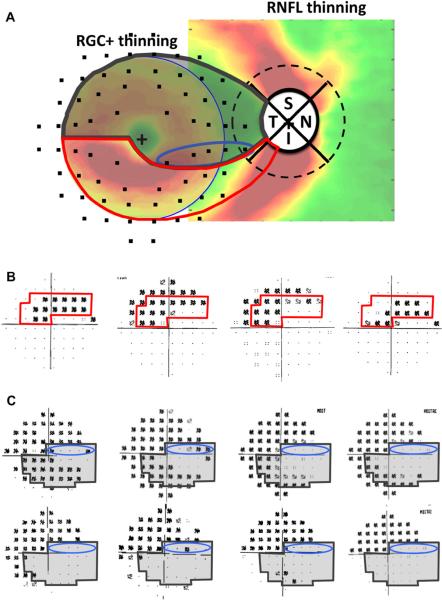
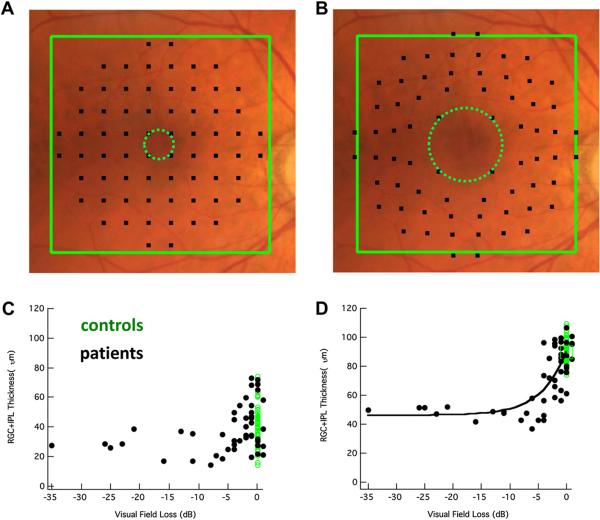
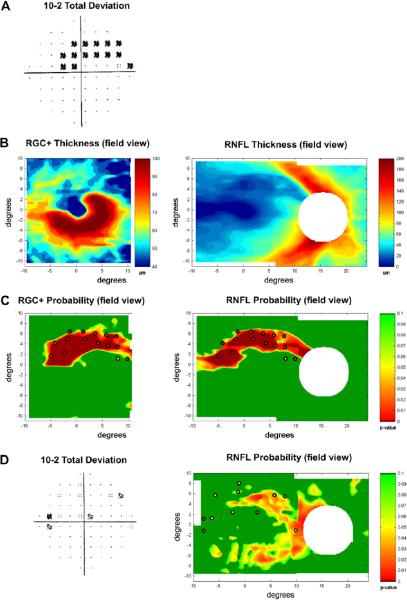
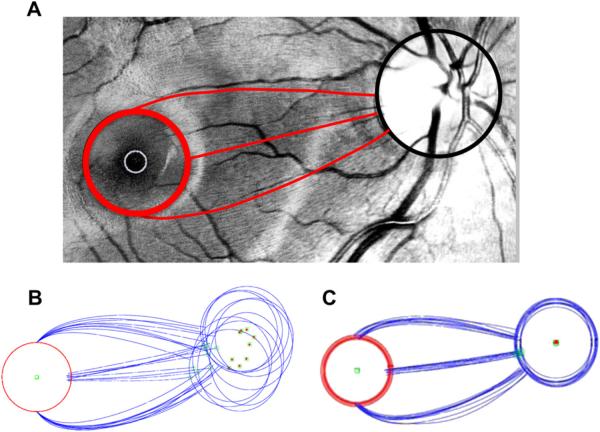
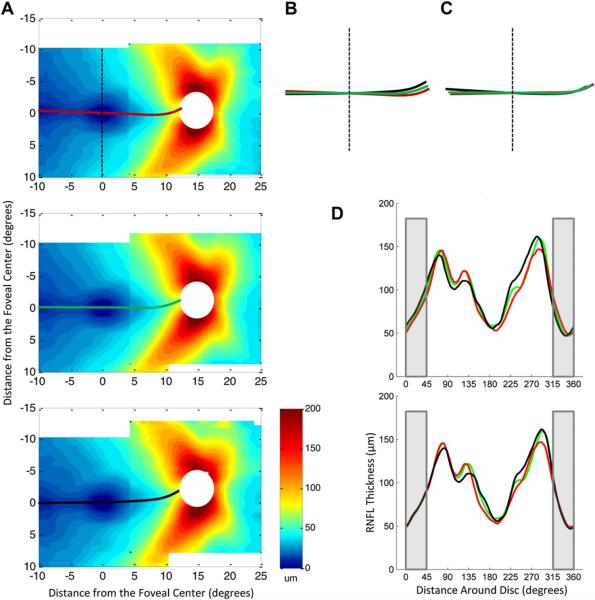
There is a growing body of evidence that early glaucomatous damage involves the macula. The anatomical basis of this damage can be studied using frequency domain optical coherence tomography (fdOCT), by which the local thickness of the retinal nerve fiber layer (RNFL) and local retinal ganglion cell plus inner plexiform (RGC+) layer can be measured. Based upon averaged fdOCT results from healthy controls and patients, we show that: 1. For healthy controls, the average RGC+ layer thickness closely matches human histological data; 2. For glaucoma patients and suspects, the average RGC+ layer shows greater glaucomatous thinning in the inferior retina (superior visual field (VF)); and 3. The central test points of the 6° VF grid (24-2 test pattern) miss the region of greatest RGC+ thinning. Based upon fdOCT results from individual patients, we have learned that: 1. Local RGC+ loss is associated with local VF sensitivity loss as long as the displacement of RGCs from the foveal center is taken into consideration; and 2. Macular damage is typically arcuate in nature and often associated with local RNFL thinning in a narrow region of the disc, which we call the macular vulnerability zone (MVZ). According to our schematic model of macular damage, most of the inferior region of the macula projects to the MVZ, which is located largely in the inferior quadrant of the disc, a region that is particularly susceptible to glaucomatous damage. A small (cecocentral) region of the inferior macula, and all of the superior macula (inferior VF), project to the temporal quadrant, a region that is less susceptible to damage. The overall message is clear; clinicians need to be aware that glaucomatous damage to the macula is common, can occur early in the disease, and can be missed and/or underestimated with standard VF tests that use a 6° grid, such as the 24-2 VF test.


Figures

Figure 1
Figure 1
Fundus view of retinal nerve fiber layer (RNFL) bundles. (A) Illustration showing the pattern of the RNFL bundles in the human retina, from Harrington and Drake (1990), with permission. (B) A fundus photo of a human eye. Notable features are labeled. The blue and red squares indicate the approximate regions scanned by the frequency domain optical coherence tomography (fdOCT) discussed below.
Figure 2
Figure 2
Layers of the retina as imaged by fdOCT and corresponding thickness profiles for both glaucoma patients and healthy controls. (A) A horizontal fdOCT scan through the fovea of a control subject showing the retinal nerve fiber layer (RNFL), retinal ganglion cell plus inner plexiform layer (RGC+), inner nuclear layer (INL), and everything from the top of the outer plexiform layer to the bottom of Bruch's membrane, including the photoreceptors (Receptor+). (B) The average RNFL thickness, ± 1 standard error, of healthy controls (blue) and glaucoma patients with sensitivity of the central (foveal) point on standard automated perimetry either within (green) or below (red) normal 95% limits. (C) RGC+ as in B. (D-E) INL and Receptor+ as in B. Modified from Wang et al. (2009).
Figure 3
Figure 3
Healthy RGC+ and RNFL anatomy as revealed by fdOCT. The left column shows the thickness maps for a single healthy individual; the center column shows a cross-sectional slice (dotted white line in left column) with relevant layers labeled (white calibration bar is 100 μm); and the right column shows average data from 128 control eyes. The centers of the optic disc were aligned for each individual before averaging. Disc centers were determined through a combination of en face fdOCT images and the edge of Bruch's membrane as imaged by cross-sectional fdOCT scans. Calibration bars are shown for the thickness maps; they range from dark red (thickest) to dark blue (zero). Modified from Hood et al. (2012).
Figure 4
Figure 4
Normal RNFL anatomy as imaged by fdOCT. (A) The average RNFL thickness in the macula and near the optic disc from 128 controls. The macula and optic disc scan regions were aligned based on the average distance and angle of the optic disc relative to the fovea. The dotted red line indicates the minimum in RNFL thickness and the dotted black line within the white circle indicates 9:00 o' clock at the disc. The dashed black circle around the optic disc, with a diameter of 3.4 mm, indicates the circular scan region typically used in circumpapillary OCT studies. (B) The circumpapillary RNFL thickness profile obtained around a circle of 3.4 mm diameter (dashed circle in A). The solid black line represents the average for all 128 controls, while the blue (n = 54) and red (n = 74) lines represent averages for those older (blue) and younger (red) than 40 years of age.
Figure 5
Figure 5
Normal RGC+ anatomy as imaged by fdOCT. (A) The average RGC+ thickness in the macula from 128 controls. The black circle has a radius of 8°. (B) Horizontal RGC+ thickness profile (dotted white line in A) as determined by fdOCT (red line) and histology (dashed black line, based upon data supplied by C. Curcio from a study by Curcio et al. (2011)). The solid black line is the same data from histology plotted against an x-axis scaled by a factor of 1.21 for best fit to our data. See text for details. (C) RGC+ thickness profiles of all 128 controls (solid red line), as well as those older than (dotted black line) and younger than (dashed blue line) 40 years of age (similar to RNFL in Fig. 4B).
Figure 6
Figure 6
Glaucomatous RNFL and RGC+ anatomy as imaged by fdOCT in patients grouped by mean deviation (MD). RNFL (left column) and RGC+ (right column) changes (thinning) in average thickness of glaucoma patients and suspects were obtained by subtracting the thickness of the controls from the thickness of the patient groups. The patients' eyes were grouped by MD of the 24-2 visual field: MD better than −1.5 dB (top row), MD between −1.5 dB and −5.5 dB (middle row), and MD worse than −5.5 dB (bottom row). The mean MD ± SD and the number of eyes are shown in parentheses. Green indicates a thickness similar to control values while red indicates a substantially thinner region (see calibration bars, lower right of each column). Modified from Hood et al. (2012).
Figure 7
Figure 7
Glaucomatous RNFL and RGC+ anatomy as imaged by fdOCT in patients grouped by classification of the upper hemifield of the VF. RNFL (left column) and RGC+ (right column) changes (thinning) in average thickness of glaucoma patients and suspects were obtained by subtracting the thickness of the controls from the thickness of the patient groups. Each row indicates a different classification of defect pattern based on inspection of the 24-2 visual fields. The superior retinal region is obscured by the black rectangle as a reminder that only the inferior retina (upper VF) is of interest here. The mean MD ± SD for the upper hemifield and the number of eyes are shown in parentheses. The solid black lines are iso-thickness contours from the arcuate group repeated in the other groups (as dotted black lines). Green indicates a thickness similar to control values while red indicates a substantially thinner region (see calibration bars, lower right of each column). Modified from Hood et al. (2012).
Figure 8
Figure 8
The macula is not well-sampled by the 24-2 or 30-2, particularly after correction for RGC displacement. (A) A fundus photo with the thickness changes observed in the RGC+ of Fig. 6 (lower right panel) for a moderate to severe glaucoma group (MD worse than −5.5 dB) superimposed along with black squares indicating the test spots of the 24-2 visual field. (B) As in A, but with displacement of the 24-2 visual field test spots to account for RGC displacement. Note the region of greatest RGC+ thinning (red) is not well-sampled by the test spot locations. (C) An illustration of the displacement of RGC bodies from the fovea, modified from Drasdo et al. (2007), with permission. The large red arrow indicates the location of the cone receptor, whose connections were traced (small arrow heads) to the location of the associated RGC (large green arrow). The calibration bar is 100 μm (0.346° assuming 0.289 mm/degree). (D) As in B, but with normal control thickness values from Fig. 5D.
Figure 9
Figure 9
Initial arcuate damage within the central 10° in glaucoma patients and the associated RNFL thinning. (A) An example of a 10-2 visual field from the right eye of a glaucoma patient showing an arcuate pattern of damage. The black squares indicate a region where the patient's sensitivity to light was significantly (p ≤ 0.01) below normal. (B) The corresponding RNFL thinning map as determined by fdOCT in the glaucoma patient shown in A. (C) The circumpapillary RNFL profile (black line) for the subject shown in A and B superimposed upon a normal range (green area), as well as values thinner at the 5% (yellow) or 1% (red) level of significance. The arrow with the green dot indicates a local minimum corresponding to the arcuate pattern in B. The blue lines indicate the range of minimums for ten glaucomatous eyes with inferior retinal macular defects (from Hood et al., 2011b). (D) A schematic of the optic disc, with the green dot and blue lines from C superimposed. We refer to the region within the blue lines as the `macular vulnerability zone' (MVZ) of the disc.
Figure 10
Figure 10
Schematics of the macula and optic disc indicating features relevant to macula damage. (A) Average patterns of thinning for moderate to severe glaucoma patients (24-2 MD worse than −5.5 dB) from Fig. 6 (lower right panel). The square on the right shows the RNFL thinning map, but the region within the circle on the left shows RGC+ (and not RNFL) thinning map for the central 8°. The red, orange, and blue circles indicate a selection of RGC bodies in the inferior (red and orange) and superior (blue) retina and the associated black curves are the proposed paths of their axon bundles to the optic disc. The dotted RNFL bundles mark the boundaries of the macular RNFL bundles (the shaded gray region within the red and dark gray borders in panel B). The blue lines on the peripapillary dashed circle indicate the MVZ at the disc as in Fig. 9D. (B) The schematic model superimposed upon the RNFL thickness of healthy control from Fig. 4A. According to the schematic model, the region within the red boundaries contains the RGCs that project to the MVZ region (blue slanted lines). The RGCs in the remaining region of the macular (within the gray boundaries) are said to project to the temporal quadrant of the disc. Modified from Hood et al. (2012).
Figure 11
Figure 11
A schematic model of RNFL projections and glaucomatous RGC+ and RNFL damage. (A) The schematic model in Fig. 10B superimposed upon tracings of 1660 RNFL bundles from 55 eyes, modified from Fig. 2A in Jansonius et al. (2009), with permission. (B) The schematic model superimposed upon patterns of RGC+ and RNFL damage as in Fig. 10A. The RNFL bundles (dashed black curves) of the RGC just outside the macula project to the regions (red arcs) of the superior (S) and inferior (I) quadrants of the disc, which show the most RNFL damage.
Figure 12
Figure 12
The schematic model predicts the arcuate defects of initial macular damage and the “central isle” of relative preservation in the macula of advanced glaucoma patients. (A) The schematic model superimposed upon RGC+ and RNFL thinning in glaucoma as in Fig. 10A with 10-2 field points superimposed after correction for displacement. (B) The 10-2 VF for the eye with the initial macular arcuate defect from Fig. 9A is shown along with the 10-2 VFs for 3 other eyes with similar defects from Hood et al. (2011b). The region within the red borders corresponds to the vulnerable region within the red borders of panel A and Fig. 11. (C) Several examples of 10-2 VFs of advanced glaucoma patients with a “central isle” of relative preservation. Note that the shaded VF regions within the dark gray borders, which correspond to the region within the dark gray borders in A, are less likely to be damaged according to the schematic model.
Figure 13
Figure 13
Local structure–function relationships in the macula. (A) A fundus photo with 10-2 test points superimposed. (B) As in A, but with 10-2 test points adjusted based on RGC body displacement from the fovea. (C) Structure–function relationship between RGC+ thickness (y-axis) and 10-2 visual field sensitivity (x-axis) for the central four points of the 10-2 (see dotted green circle in A). Green dots are controls while black dots are patients. The black curve is the prediction of a simple linear model. (D) As in C, but with a correction for displacement (see dotted green circle in B). Modified from Raza et al. (2011).
Figure 14
Figure 14
A method for detecting macular damage. (A) A right eye with a macular arcuate defect on the 10-2 VF. (B) The RGC+ (left panel) and RNFL (right panel) thickness plots in field view for the patient with a macular arcuate defect shown in A. (C) Continuous probability maps comparing the patient's RGC+ (left) and RNFL (right) thickness to controls (see calibration bar for significance levels). The abnormal 10-2 visual field points from panel A are superimposed. (D) An example where the combined VF and fdOCT RNFL probability maps (right panel) suggest arcuate damage, while the total deviation map (left panel) of the patient's 10-2 VF is ambiguous. Modified from Hood and Raza (2011).
Figure 15
Figure 15
Changes in the RNFL bundle projections with different locations of the optic disc. (A) A digitally red-filtered fundus photo with tracings of 3 RNFL bundles in red. (B) Tracings as in panel A for 11 eyes. The green square with the red dot is the center of the optic disc. The open green square is the location on the disc associated with the RNFL originating at the 3 o'clock position on the red circles around the fovea. (C) Tracings from panel B after scaling and rotating to align the centers of the optic discs.
Figure 16
Figure 16
Variation in the RNFL thickness distributions among healthy controls with different angles of vertical displacement of the optic disc relative to the fovea. (A) RNFL thickness distributions of controls divided into groups based on the angle of vertical displacement of the optic disc, with the RNFL minimum marked by bold lines. The top group (red line for minimum) had the smallest angle [−1.95–4.24° (n = 33)], the middle group (green line) had the typical angle [4.33–8.21° (mean ± 2°, n = 65)], and the bottom group (black line) had the largest angle [8.36–13.96° (>mean + 2°, n = 30)]. (B) The minima from the three groups in A, superimposed. (C) Rotation of the minima in B based on median optic disc elevation of each group. (D) Circumpapillary RNFL profiles of each group in A, before (top) and after (bottom) a rotational correction based on the optic disc elevation of each group. The gray shaded area indicates the region corresponding to the temporal quadrant of the optic disc.

References

    1. Airaksinen PJ, Heijl A. Visual field and retinal nerve fibre layer in early glaucoma after optic disc haemorrhage. Acta Ophthalmol. (Copenh.) 1983;61:186–194. - PubMed
    1. Anctil J-L, Anderson DR. Early foveal involvement and generalized depression of the visual field in glaucoma. Arch. Ophthalmol. 1984;102:363–370. - PubMed
    1. Araie M. Pattern of visual field defects in normal-tension and high-tension glaucoma. Curr. Opin. Ophthalmol. 1995;6:36–45. - PubMed
    1. Aulhorn E, Harms M. Early visual field defects in glaucoma. In: Leydhecker W, editor. Glaucoma, Tutzing Symposium. Karger, Basel: 1967. pp. 151–186.
    1. Aulhorn E, Karmeyer H. Frequency distribution in early glaucomatous visual field defects. Doc. Ophthalmol. Proc. Ser. 1977;14:75–83.

Publication types