

Mass spectrometry imaging under ambient conditions
- PMID: 22996621
- PMCID: PMC3530640
- DOI: 10.1002/mas.21360
Mass spectrometry imaging under ambient conditions
Abstract
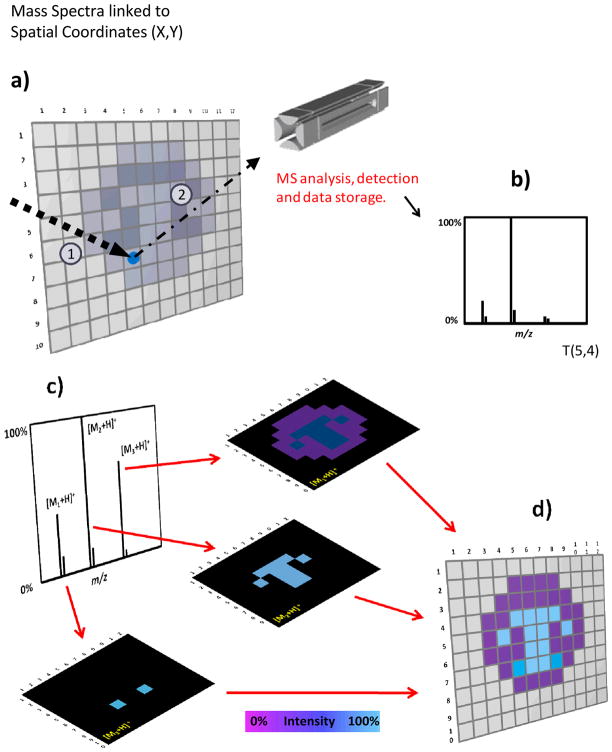
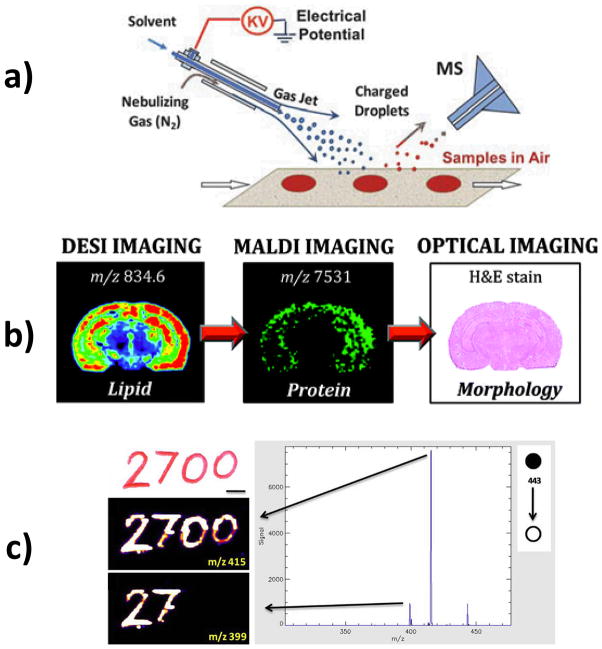
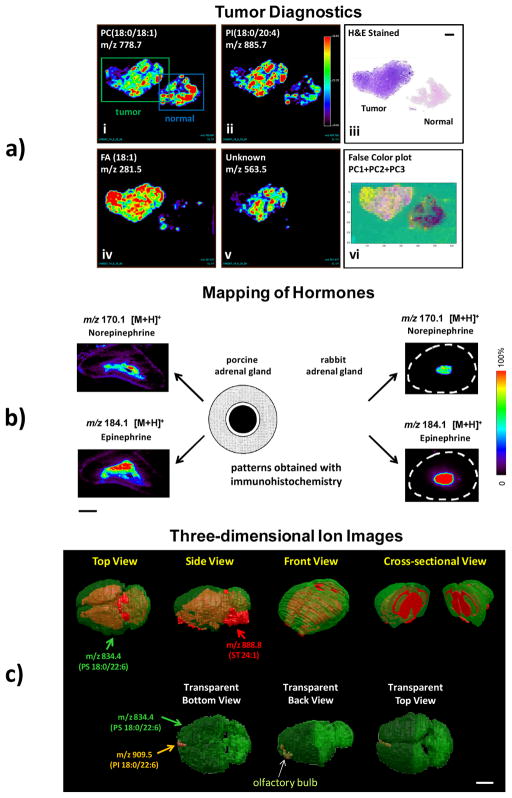
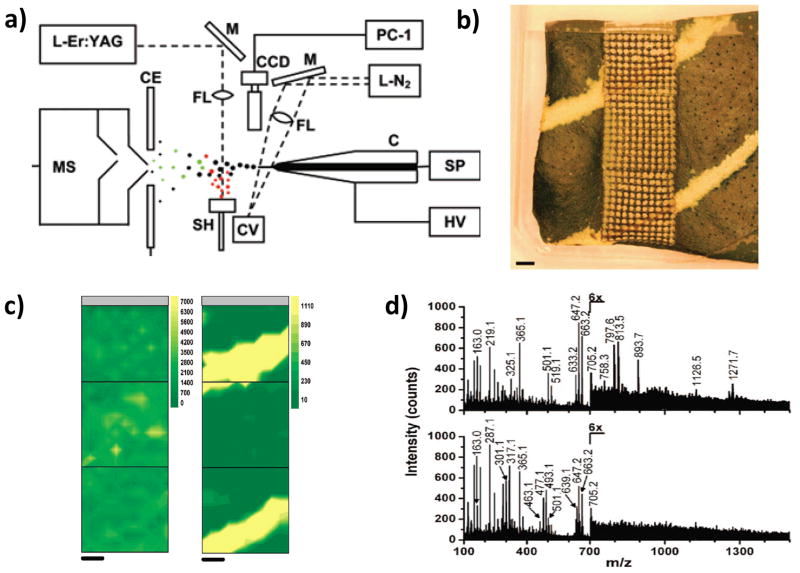
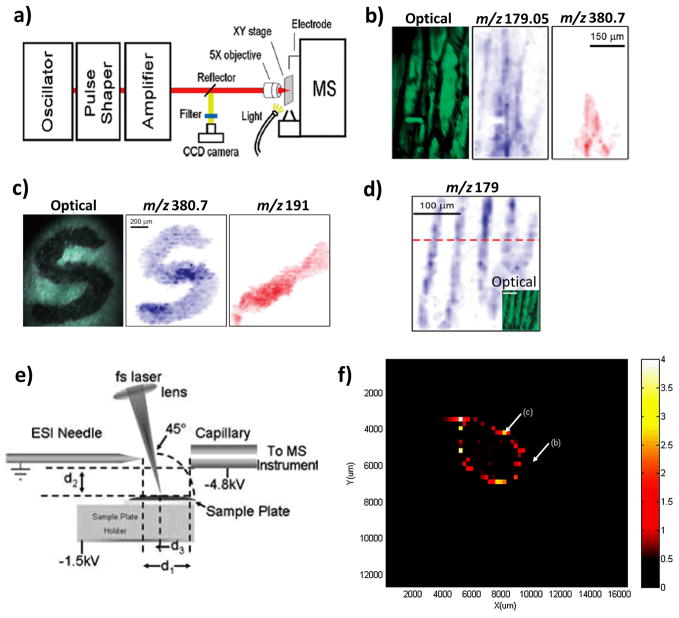
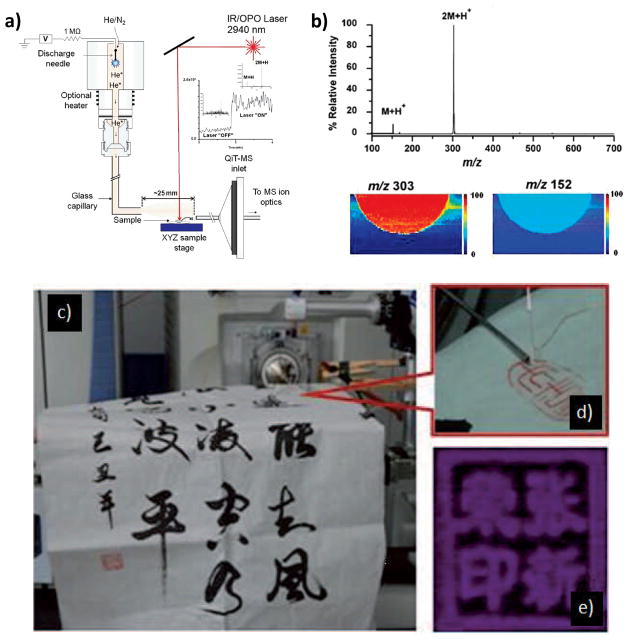
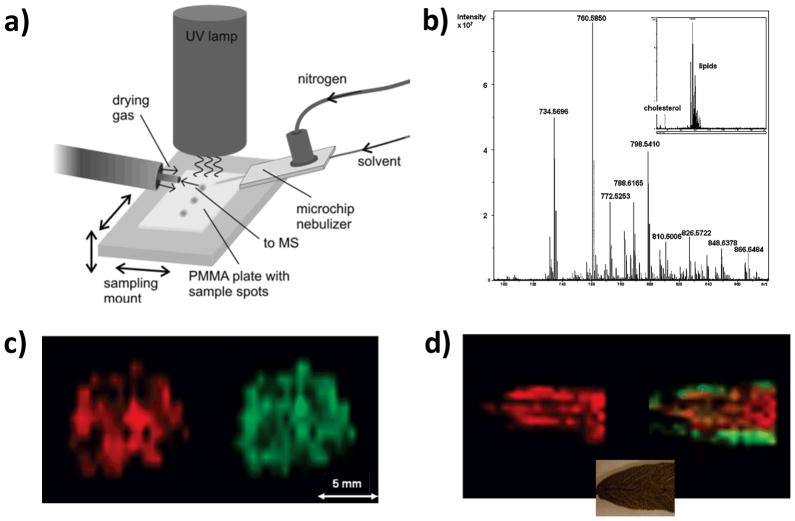
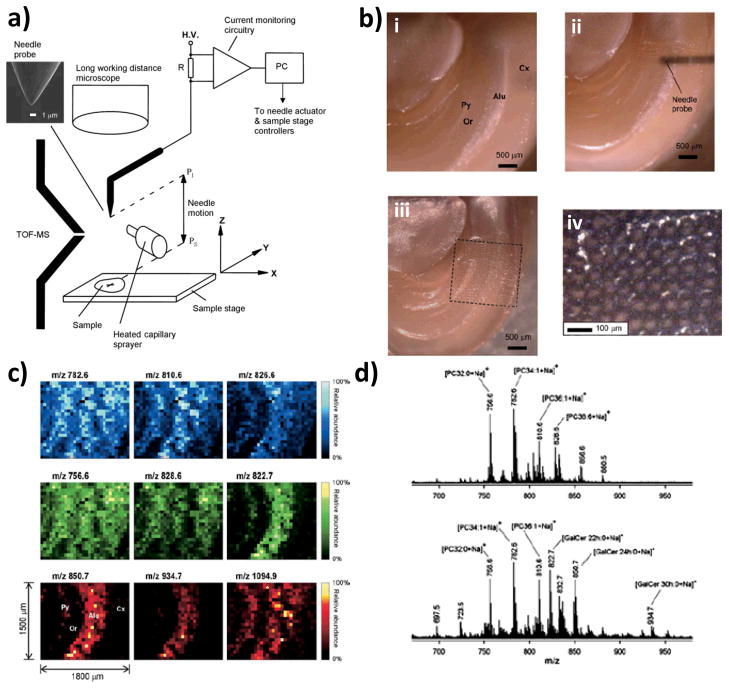
Mass spectrometry imaging (MSI) has emerged as an important tool in the last decade and it is beginning to show potential to provide new information in many fields owing to its unique ability to acquire molecularly specific images and to provide multiplexed information, without the need for labeling or staining. In MSI, the chemical identity of molecules present on a surface is investigated as a function of spatial distribution. In addition to now standard methods involving MSI in vacuum, recently developed ambient ionization techniques allow MSI to be performed under atmospheric pressure on untreated samples outside the mass spectrometer. Here we review recent developments and applications of MSI emphasizing the ambient ionization techniques of desorption electrospray ionization (DESI), laser ablation electrospray ionization (LAESI), probe electrospray ionization (PESI), desorption atmospheric pressure photoionization (DAPPI), femtosecond laser desorption ionization (fs-LDI), laser electrospray mass spectrometry (LEMS), infrared laser ablation metastable-induced chemical ionization (IR-LAMICI), liquid microjunction surface sampling probe mass spectrometry (LMJ-SSP MS), nanospray desorption electrospray ionization (nano-DESI), and plasma sources such as the low temperature plasma (LTP) probe and laser ablation coupled to flowing atmospheric-pressure afterglow (LA-FAPA). Included are discussions of some of the features of ambient MSI for example the ability to implement chemical reactions with the goal of providing high abundance ions characteristic of specific compounds of interest and the use of tandem mass spectrometry to either map the distribution of targeted molecules with high specificity or to provide additional MS information on the structural identification of compounds. We also describe the role of bioinformatics in acquiring and interpreting the chemical and spatial information obtained through MSI, especially in biological applications for tissue diagnostic purposes. Finally, we discuss the challenges in ambient MSI and include perspectives on the future of the field.
Copyright © 2012 Wiley Periodicals, Inc.
Figures
Similar articles
-
Surface analysis of lipids by mass spectrometry: more than just imaging.Prog Lipid Res. 2013 Oct;52(4):329-53. doi: 10.1016/j.plipres.2013.04.005. Epub 2013 Apr 24. Prog Lipid Res. 2013. PMID: 23623802 Review.
-
[Recent progress in mass spectrometry imaging using nanospray desorption electrospray ionization].Se Pu. 2025 Jan;43(1):43-49. doi: 10.3724/SP.J.1123.2024.07013. Se Pu. 2025. PMID: 39722620 Free PMC article. Review. Chinese.
-
Mass spectrometry imaging for visualizing organic analytes in food.Mass Spectrom Rev. 2015 Nov-Dec;34(6):641-58. doi: 10.1002/mas.21424. Epub 2014 Mar 28. Mass Spectrom Rev. 2015. PMID: 24687728
-
Automated ambient desorption-ionization platform for surface imaging integrated with a commercial Fourier transform ion cyclotron resonance mass spectrometer.Anal Chem. 2009 Oct 15;81(20):8479-87. doi: 10.1021/ac901368q. Anal Chem. 2009. PMID: 19761221
-
Mass Spectrometry Imaging Techniques: Non-Ambient and Ambient Ionization Approaches.Crit Rev Anal Chem. 2024 Jun 18:1-54. doi: 10.1080/10408347.2024.2362703. Online ahead of print. Crit Rev Anal Chem. 2024. PMID: 38889072 Review.
Cited by
-
Metabotype analysis of Mthfd1l-null mouse embryos using desorption electrospray ionization mass spectrometry imaging.Anal Bioanal Chem. 2021 May;413(13):3573-3582. doi: 10.1007/s00216-021-03308-5. Epub 2021 Apr 8. Anal Bioanal Chem. 2021. PMID: 33829277
-
Direct Analysis and Quantification of Metaldehyde in Water using Reactive Paper Spray Mass Spectrometry.Sci Rep. 2016 Oct 21;6:35643. doi: 10.1038/srep35643. Sci Rep. 2016. PMID: 27767044 Free PMC article.
-
Imaging mass spectrometry: enabling a new age of discovery in biology and medicine through molecular microscopy.J Am Soc Mass Spectrom. 2015 Jun;26(6):850-2. doi: 10.1007/s13361-015-1108-z. Epub 2015 Mar 24. J Am Soc Mass Spectrom. 2015. PMID: 25801587 Free PMC article.
-
Tissue classification by rapid evaporative ionization mass spectrometry (REIMS): comparison between a diathermic knife and CO2 laser sampling on classification performance.Anal Bioanal Chem. 2019 Dec;411(30):7943-7955. doi: 10.1007/s00216-019-02148-8. Epub 2019 Nov 11. Anal Bioanal Chem. 2019. PMID: 31713015 Free PMC article.
-
Unsupervised segmentation of mass spectrometric ion images characterizes morphology of tissues.Bioinformatics. 2019 Jul 15;35(14):i208-i217. doi: 10.1093/bioinformatics/btz345. Bioinformatics. 2019. PMID: 31510675 Free PMC article.
References
-
- Alberici RM, Simas RC, Sanvido GB, Romao W, Lalli PM, Benassi M, Cunha IBS, Eberlin MN. Ambient mass spectrometry: bringing MS into the “real world”. Anal Bioanal Chem. 2010;398:265–294. - PubMed
-
- Altelaar AFM, van Minnen J, Jimenez CR, Heeren RMA, Piersma SR. Direct molecular Imaging of Lymnaea stagnalis nervous tissue at subcellular spatial resolution by mass spectrometry. Anal Chem. 2005;77:735–741. - PubMed
-
- Andrade FJ, Shelley JT, Wetzel WC, Webb MR, Gamez G, Ray SJ, Hieftje GM. Atmospheric pressure chemical ionization source. 1 Ionization of compounds in the gas phase. Anal Chem. 2008;80:2646–2653. - PubMed
-
- Augusti R, Chen H, Eberlin LS, Nefliu M, Cooks RG. Atmospheric pressure Eberlin transacetalization reactions in the heterogeneous liquid/gas phase. International Journal of Mass Spectrometry. 2006;253:281–287.
-
- Balog J, Szaniszlo T, Schaefer KC, Denes J, Lopata A, Godorhazy L, Szalay D, Balogh L, Sasi-Szabo L, Toth M, Takats Z. Identification of Biological Tissues by Rapid Evaporative Ionization Mass Spectrometry. Anal Chem. 2010;82:7343–7350. - PubMed
Publication types
MeSH terms
Grants and funding
LinkOut - more resources
Full Text Sources
Other Literature Sources
