. 2012 Oct;122(10):3579-92.
doi: 10.1172/JCI38576. Epub 2012 Sep 17.

The ADP receptor P2RY12 regulates osteoclast function and pathologic bone remodeling

Affiliations

The ADP receptor P2RY12 regulates osteoclast function and pathologic bone remodeling

Xinming Su et al. J Clin Invest. 2012 Oct.

Abstract

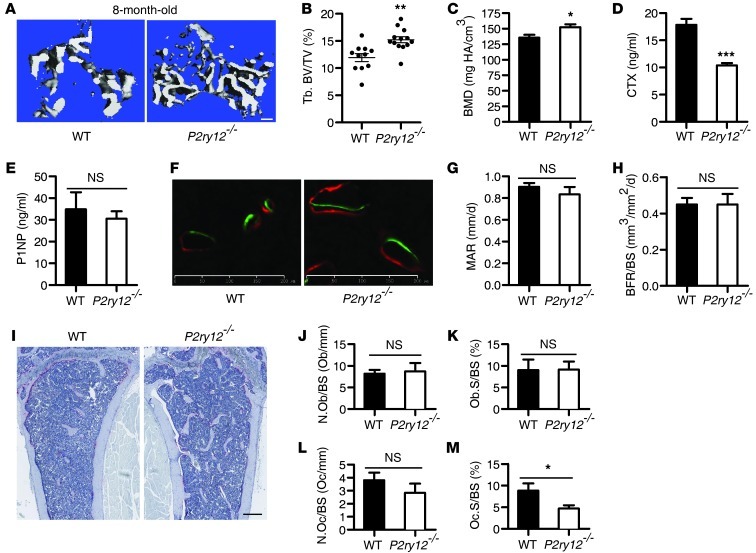
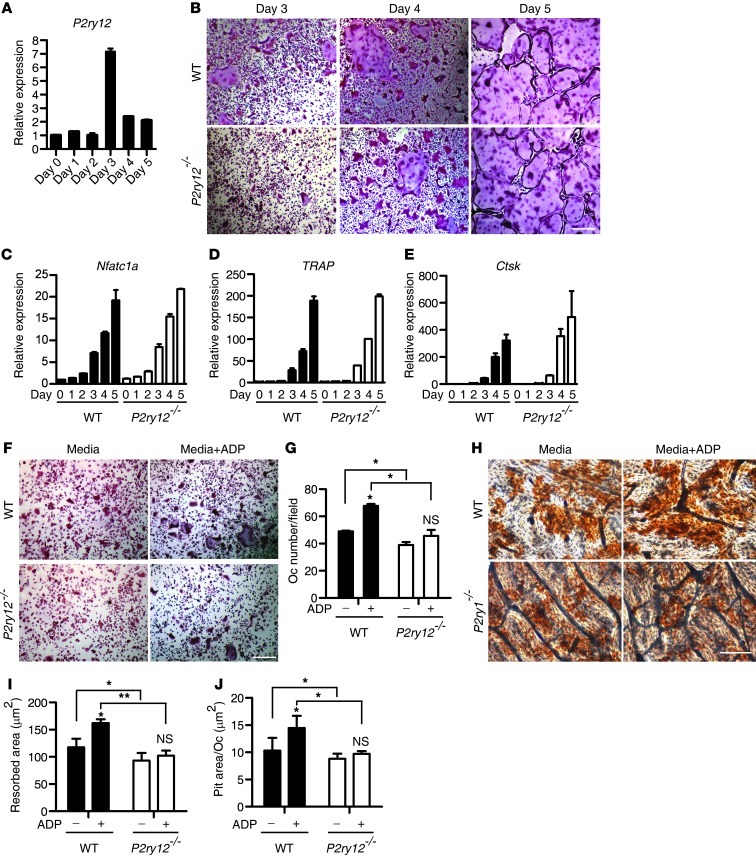
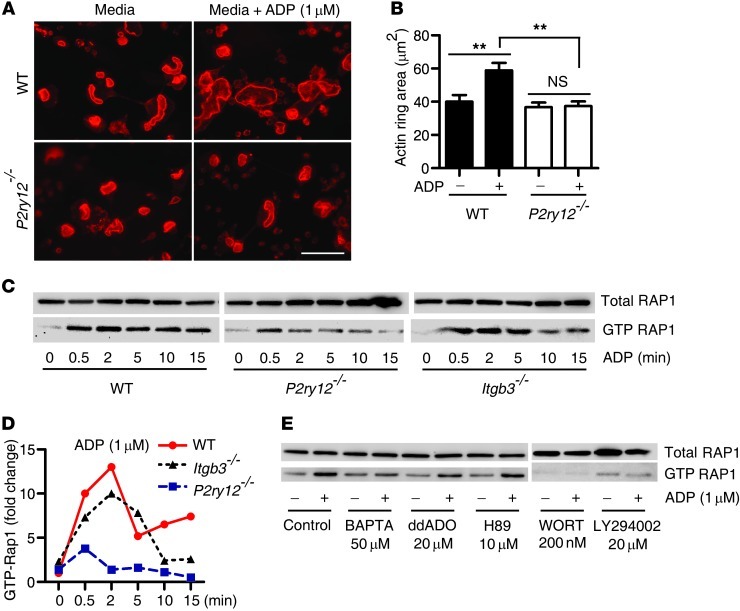
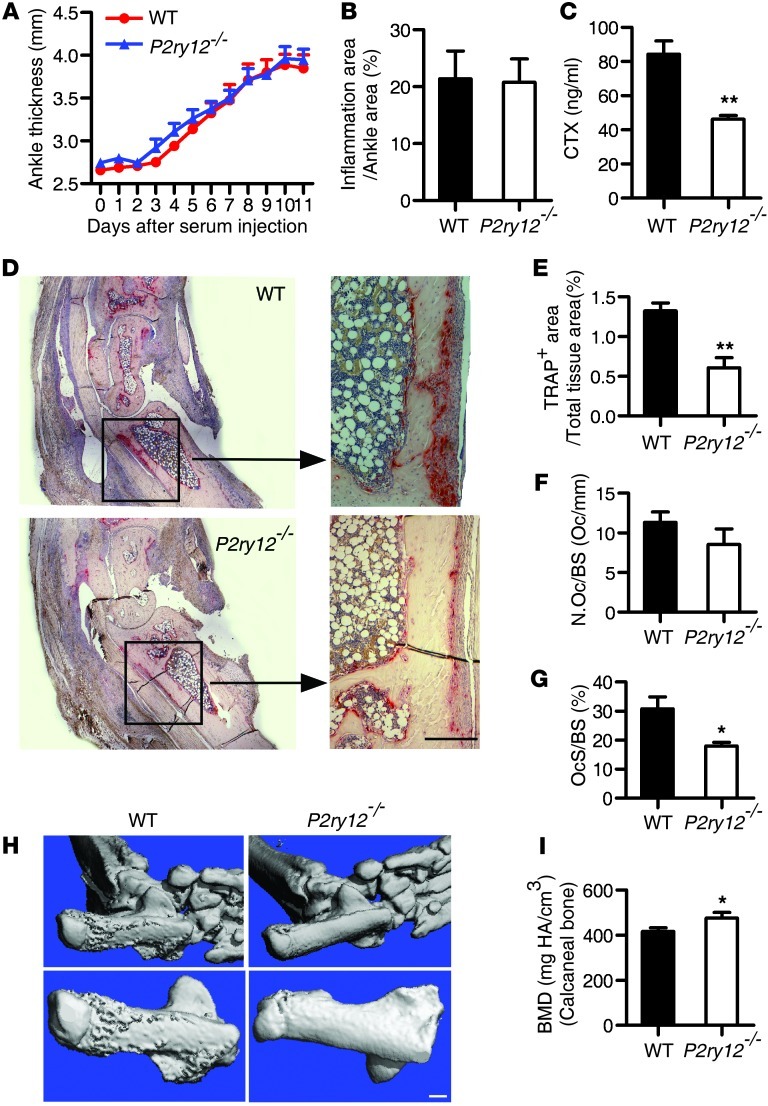
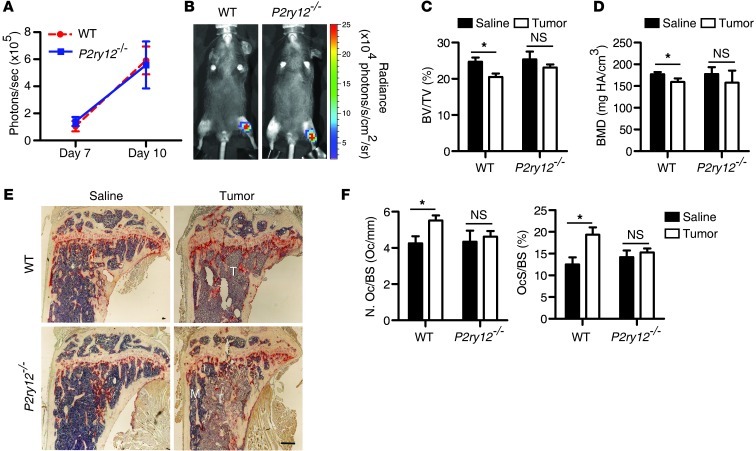
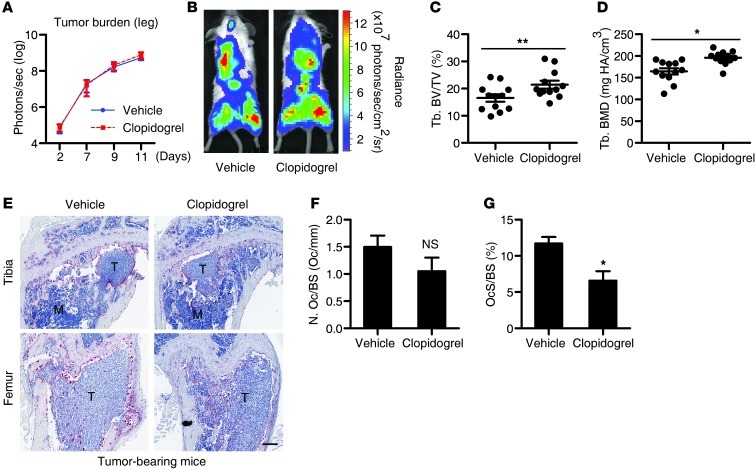
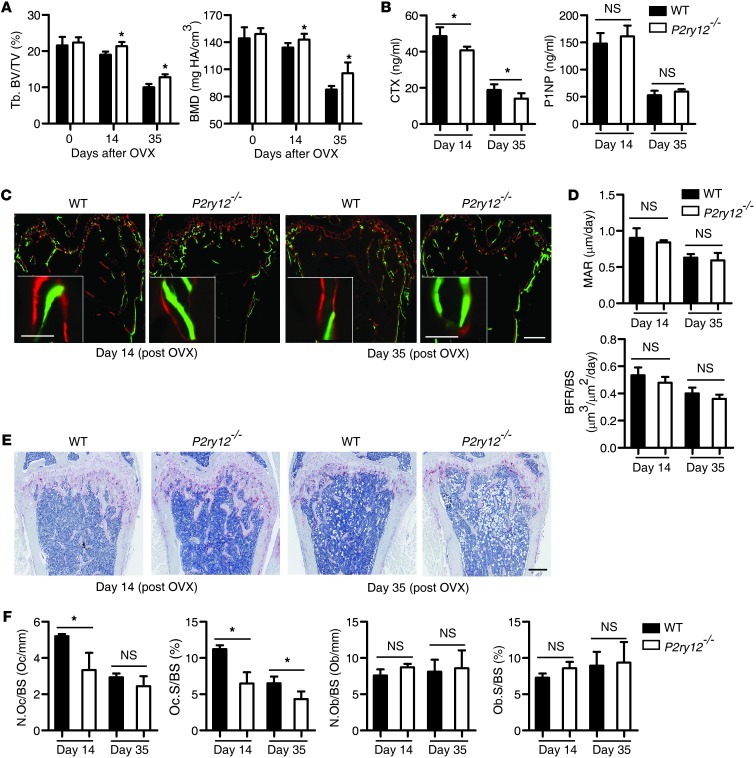
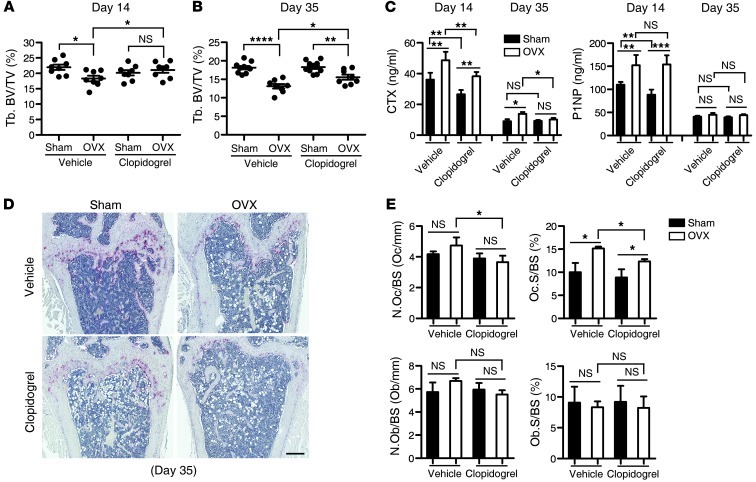
The adenosine diphosphate (ADP) receptor P2RY12 (purinergic receptor P2Y, G protein coupled, 12) plays a critical role in platelet aggregation, and P2RY12 inhibitors are used clinically to prevent cardiac and cerebral thrombotic events. Extracellular ADP has also been shown to increase osteoclast (OC) activity, but the role of P2RY12 in OC biology is unknown. Here, we examined the role of mouse P2RY12 in OC function. Mice lacking P2ry12 had decreased OC activity and were partially protected from age-associated bone loss. P2ry12-/- OCs exhibited intact differentiation markers, but diminished resorptive function. Extracellular ADP enhanced OC adhesion and resorptive activity of WT, but not P2ry12-/-, OCs. In platelets, ADP stimulation of P2RY12 resulted in GTPase Ras-related protein (RAP1) activation and subsequent αIIbβ3 integrin activation. Likewise, we found that ADP stimulation induced RAP1 activation in WT and integrin β3 gene knockout (Itgb3-/-) OCs, but its effects were substantially blunted in P2ry12-/- OCs. In vivo, P2ry12-/- mice were partially protected from pathologic bone loss associated with serum transfer arthritis, tumor growth in bone, and ovariectomy-induced osteoporosis: all conditions associated with increased extracellular ADP. Finally, mice treated with the clinical inhibitor of P2RY12, clopidogrel, were protected from pathologic osteolysis. These results demonstrate that P2RY12 is the primary ADP receptor in OCs and suggest that P2RY12 inhibition is a potential therapeutic target for pathologic bone loss.


Figures

Figure 1
Figure 1. P2ry12–/– mice were protected from age-associated bone loss.
(AC) The primary and secondary spongiosa of the tibias of age- and sex-matched WT and P2ry12–/– littermate mice were analyzed by μCT scanning. (A) Representative 3D reconstructions of trabecular bone. Scale bar: 200 μm. (B) Calculation of BV/TV and (C) BMD. Tb, trabecular bone. (D and E) Serum concentration of CTX and P1NP measured by ELISA. (F) Bone formation was visualized by calcein (first) and alizarin red (second) double-labeling and visualized in the trabecular bone. Scale bars: 200 μm. MAR and BFR are shown (G and H). Bone histology, representative TRAP staining (I). Scale bar: 300 μm. (JM) Quantification of OB and OC cells in the primary and secondary spongiosa of the femur. OC number and OC surface per bone surface, OB number and OB surface per bone surface are shown. Data represent mean ± SD. n = 6. *P < 0.05; **P < 0.01; ***P < 0.001.
Figure 2
Figure 2. ADP enhances ex vivo OC bone resorption primarily through the P2RY12 receptor.
(A) Quantitative real-time PCR of P2ry12 expression on day 0 through day 5 of OC differentiation. (B) WT and P2ry12–/– OCs stained for the OC marker protein TRAP on days 3–5 of OC differentiation. Scale bar: 300 μm. (CE) Quantitative real-time RT-PCR of OC differentiation markers; nuclear factor of activated T cells, cytoplasmic 1α (Nfatc1α), TRAP, and cathepsin K (Ctsk), normalized to levels of gapdh, comparing WT (black bars) and P2ry12–/– (white bars) cells on days 0–5 of OC culture. (F) WT and P2ry12–/– macrophages were cultured with 50 ng/ml M-CSF and 50 ng/ml RANKL and treated with or without 1 μM ADP for 3 days. Day 3 OC culture was stained for the OC marker protein TRAP. Scale bar: 300 μm. (G) Quantitation of OC number (≥ 3 nuclei). (H) BMMs derived from 8-month-old WT or P2ry12–/– mice were cultured with RANKL and MCSF on bone slices for 5 days. ADP was added at a final concentration of 1 μM where indicated. Scale bar: 100 μm. (I and J) Quantification of bone pit area. Data represent mean ± SD. n = 3 per condition. *P < 0.05; **P < 0.01.
Figure 3
Figure 3. P2ry12–/– OCs showed impaired ADP-induced RAP1 activation.
(A and B) BMMs derived from 8-month-old WT or P2ry12–/– mice were cultured with RANKL and MCSF on bone slices for 5 days. ADP was added at a final concentration of 1 μM where indicated. (A) Actin ring formation was determined by immunofluorescence following Rhodamine-phalloidin staining. Scale bar: 100 μm. Actin ring area was quantitated in B. (C) Western blots of total RAP1 and RAP1-GTP in ADP-stimulated pre-OCs (day 3 OC culture). WT and P2ry12–/– pre-OCs were treated with ADP (1 μM) for 0–15 minutes. Total RAP1 was detected in total cell lysate, while activated RAP1 (RAP1-GTP) was pulled down by using Ral GDS-RBD–labeled agarose beads. (D) Densitometry of GTP-RAP1 induction versus WT time 0. (E) WT pre-OCs were treated with or without 1 μM ADP and BAPTA, ddADO, H89, or inhibitors of PI3K (wortmannin or LY294002), as indicated. Total RAP1 and activated RAP1 were detected as above. Data represent mean ± SD and are representative of at least 3 experiments. **P < 0.01.
Figure 4
Figure 4. P2ry12–/– mice had decreased arthritis-associated bone loss.
STA was induced in 6-week-old WT (n = 8) or P2ry12–/– (n = 6) mice by injection of K/BxN serum on days 0 and 2. (A) Hind paw thickness was measured bilaterally daily. (B) Inflammation area over total ankle area was determined by measuring inflammatory tissue area on hematoxylin staining of ankle tissue. (C) Serum CTX assay to measure OC activity on day 11. n = 5 per group. (DF) Histological analyses of ankle with TRAP staining. Scale bar: 100 μm. Scale bar: 100 μm. Quantitation of TRAP+ area (E), OC number (N.) per bone surface (F), and OC surface per bone surface (G) in the boxed ROI. (H and I) Representative μCT 3D reconstructions of hind limb ankle joints 11 days following STA induction and calcaneal bone BMD are shown. Scale bar: 300 μm. Data represent mean ± SD. *P < 0.05; **P < 0.01.
Figure 5
Figure 5. Genetic inhibition of P2RY12 protected mice from tumor-associated bone loss.
(A and B) 1 × 10⁴ B16-FL tumor cells (right leg) or PBS (control, left leg) were injected directly into the tibia (n = 6 per group). (A and B) The tumor burden in hind limbs was measured by BLI. (C and D) BV/TV and BMD in the primary and secondary spongiosa of PBS-injected or tumor-bearing tibia were analyzed by μCT. (E) TRAP-stained tibial sections (×4) of WT (top) and P2ry12–/– mice (bottom) 10 days after tumor injection. T, tumor; M, marrow. TRAP+ staining (dark red areas) indicates OC presence. Scale bar: 300 μm. (F) OC number and surface per bone surface in the primary and secondary spongiosa of the tibia are shown in saline-injected tibia (S) (black bars) and tumor-injected tibia (T) (white bars). Data represent mean ± SD. n = 6. *P < 0.05.
Figure 6
Figure 6. Pharmacologic inhibition of P2RY12 protected mice from tumor-associated bone loss.
4T1-GFP-FL tumor cells were directly injected into the left cardiac ventricle of WT Balb/c mice (n = 12 per group). Clopidogrel treatment (30 mg/kg/d in drinking water) was begun 2 days after tumor cell injection and continued for 9 days. (A) The tumor burden in hind limbs measured by BLI and (B) representative pictures of BLI at day 11. (C and D) BV/TV and BMD of the tibia of tumor-bearing mice at day 11 were analyzed by μCT. (E) TRAP-stained hind limb sections at day 11 after tumor injection and vehicle or clopidogrel treatment. TRAP+ staining (dark red areas) indicates OC presence. Scale bar: 300 μm. OC number and surface in the primary and secondary spongiosa of the tibia are shown (F and G). Data represent mean ± SD. *P < 0.05; **P < 0.01.
Figure 7
Figure 7. P2ry12–/– mice were partially protected from OVX-induced bone loss.
OVX was performed on 14-week-old P2ry12–/– and WT littermates (n = 5 per group). (A) BV/TV and BMD were measured in the primary and secondary spongiosa of the tibia of live animals viva CT scanning prior to and at days 14 and 35 following OVX. (B) Serum concentration of CTX and P1NP measured by ELISA. (C) Bone formation was visualized by calcein (first) and alizarin red (second) double-labeling and visualized in the trabecular bone. Representative photographs: original magnification, ×2.5, scale bar: 300 μm; original magnification, ×20, scale bar: 50 μm. (D) MAR and BFR were measured. (E) TRAP-stained hind limb sections after OVX. Scale bar: 300 μm. (F) Quantification of OC and OB cells in the primary and secondary spongiosa of the femur. Data represent mean ± SD. n = 5. *P < 0.05.
Figure 8
Figure 8. P2RY12 antagonism partially protected mice from OVX-induced bone loss.
14-week-old WT C57BL/6 mice underwent OVX (n = 8) or sham operation (sham) (n = 10) and were treated with clopidogrel (30 mg/kg/day) or vehicle-control in drinking water for 2 or 5 weeks. Tibias from sham-operated and OVX mice were examined by μCT. (A and B) BV/TV in the primary and secondary spongiosa of the tibia after OVX. (C) Serum concentration of CTX and P1NP measured by ELISA. (D) TRAP-stained hind limb sections after OVX. Scale bar: 300 μm. (E) Quantification of OC and OB cells 35 days after OVX. OC number (N.OC) per bone surface (N.OC/BS) and OB number per bone surface (N.OB/BS) in the primary and secondary spongiosa of the femur. Data represent mean ± SD. n = 5. *P < 0.05; **P < 0.01; ***P < 0.001; ****P < 0.0001.

Comment in

Similar articles

Cited by

References

    1. Teitelbaum SL. Bone resorption by osteoclasts. Science. 2000;289(5484):1504–1508. doi: 10.1126/science.289.5484.1504. - DOI - PubMed
    1. Weilbaecher KN, Guise TA, McCauley LK. Cancer to bone: a fatal attraction. Nat Rev Cancer. 2011;11(6):411–425. doi: 10.1038/nrc3055. - DOI - PMC - PubMed
    1. Orriss I, et al. Bone phenotypes of P2 receptor knockout mice. Front Biosci (Schol Ed). 2011;3:1038–1046. - PubMed
    1. Reyes JP, Sims SM, Dixon SJ. P2 receptor expression, signaling and function in osteoclasts. Front Biosci (Schol Ed). 2011;3:1101–1118. - PubMed
    1. Korcok J, Raimundo LN, Du X, Sims SM, Dixon SJ. P2Y6 nucleotide receptors activate NF-kappaB and increase survival of osteoclasts. J Biol Chem. 2005;280(17):16909–16915. doi: 10.1074/jbc.M410764200. - DOI - PubMed

Publication types

MeSH terms

Substances