Validation of a robust proteomic analysis carried out on formalin-fixed paraffin-embedded tissues of the pancreas obtained from mouse and human
- PMID: 22997103
- PMCID: PMC3656494
- DOI: 10.1002/pmic.201100663
Validation of a robust proteomic analysis carried out on formalin-fixed paraffin-embedded tissues of the pancreas obtained from mouse and human
Abstract
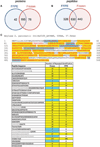
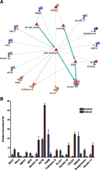
A number of reports have recently emerged with focus on extraction of proteins from formalin-fixed paraffin-embedded (FFPE) tissues for MS analysis; however, reproducibility and robustness as compared to flash frozen controls is generally overlooked. The goal of this study was to identify and validate a practical and highly robust approach for the proteomics analysis of FFPE tissues. FFPE and matched frozen pancreatic tissues obtained from mice (n = 8) were analyzed using 1D-nanoLC-MS(MS)(2) following work up with commercially available kits. The chosen approach for FFPE tissues was found to be highly comparable to that of frozen. In addition, the total number of unique peptides identified between the two groups was highly similar, with 958 identified for FFPE and 1070 identified for frozen, with protein identifications that corresponded by approximately 80%. This approach was then applied to archived human FFPE pancreatic cancer specimens (n = 11) as compared to uninvolved tissues (n = 8), where 47 potential pancreatic ductal adenocarcinoma markers were identified as significantly increased, of which 28 were previously reported. Further, these proteins share strongly overlapping pathway associations to pancreatic cancer that include estrogen receptor α. Together, these data support the validation of an approach for the proteomic analysis of FFPE tissues that is straightforward and highly robust, which can also be effectively applied toward translational studies of disease.
© 2012 WILEY-VCH Verlag GmbH & Co. KGaA, Weinheim.
Conflict of interest statement
The authors have declared no conflict of interest.
Figures


Similar articles
-
Equivalence of protein inventories obtained from formalin-fixed paraffin-embedded and frozen tissue in multidimensional liquid chromatography-tandem mass spectrometry shotgun proteomic analysis.Mol Cell Proteomics. 2009 Aug;8(8):1988-98. doi: 10.1074/mcp.M800518-MCP200. Epub 2009 May 24. Mol Cell Proteomics. 2009. PMID: 19467989 Free PMC article.
-
A proteomic comparison of formalin-fixed paraffin-embedded pancreatic tissue from autoimmune pancreatitis, chronic pancreatitis, and pancreatic cancer.JOP. 2013 Jul 10;14(4):405-14. doi: 10.6092/1590-8577/1508. JOP. 2013. PMID: 23846938 Free PMC article.
-
Proteomic analysis of formalin-fixed paraffin-embedded pancreatic tissue using liquid chromatography tandem mass spectrometry.Pancreas. 2012 Mar;41(2):175-85. doi: 10.1097/MPA.0b013e318227a6b7. Pancreas. 2012. PMID: 22015969 Free PMC article.
-
Comparative evaluation of two methods for LC-MS/MS proteomic analysis of formalin fixed and paraffin embedded tissues.J Proteomics. 2021 Mar 20;235:104117. doi: 10.1016/j.jprot.2021.104117. Epub 2021 Jan 14. J Proteomics. 2021. PMID: 33453434 Free PMC article. Review.
-
Toward deciphering proteomes of formalin-fixed paraffin-embedded (FFPE) tissues.Proteomics. 2012 Apr;12(7):1045-58. doi: 10.1002/pmic.201100550. Proteomics. 2012. PMID: 22318899 Free PMC article. Review.
Cited by
-
A novel humanized GLP-1 receptor model enables both affinity purification and Cre-LoxP deletion of the receptor.PLoS One. 2014 Apr 2;9(4):e93746. doi: 10.1371/journal.pone.0093746. eCollection 2014. PLoS One. 2014. PMID: 24695667 Free PMC article.
-
Chemical composition and the potential for proteomic transformation in cancer, hypoxia, and hyperosmotic stress.PeerJ. 2017 Jun 6;5:e3421. doi: 10.7717/peerj.3421. eCollection 2017. PeerJ. 2017. PMID: 28603672 Free PMC article.
-
Proteomic analyses identify prognostic biomarkers for pancreatic ductal adenocarcinoma.Oncotarget. 2018 Jan 3;9(11):9789-9807. doi: 10.18632/oncotarget.23929. eCollection 2018 Feb 9. Oncotarget. 2018. PMID: 29515771 Free PMC article.
-
Visualization and Identification of Bioorthogonally Labeled Exosome Proteins Following Systemic Administration in Mice.Front Cell Dev Biol. 2021 Apr 7;9:657456. doi: 10.3389/fcell.2021.657456. eCollection 2021. Front Cell Dev Biol. 2021. PMID: 33898459 Free PMC article.
-
DNA from dead cancer cells induces TLR9-mediated invasion and inflammation in living cancer cells.Breast Cancer Res Treat. 2013 Dec;142(3):477-87. doi: 10.1007/s10549-013-2762-0. Epub 2013 Nov 10. Breast Cancer Res Treat. 2013. PMID: 24212717 Free PMC article.
References
-
- Mahadevan D, Von Hoff DD. Tumor-stroma interactions in pancreatic ductal adenocarcinoma. Mol. Cancer Ther. 2007;6:1186–1197. - PubMed
-
- Siegel R, Ward E, Brawley O, Jemal A. Cancer statistics, The impact of eliminating socioeconomic and racial disparities on premature cancer deaths. CA Cancer J. Clin. 2011;61:212–236. - PubMed
Publication types
MeSH terms
Substances
Grants and funding
LinkOut - more resources
Full Text Sources
Medical

