. 2012 Dec;192(4):1411-32.
doi: 10.1534/genetics.112.145714. Epub 2012 Sep 20.

Long-term and short-term evolutionary impacts of transposable elements on Drosophila

Affiliations

Long-term and short-term evolutionary impacts of transposable elements on Drosophila

Yuh Chwen G Lee et al. Genetics. 2012 Dec.

Abstract

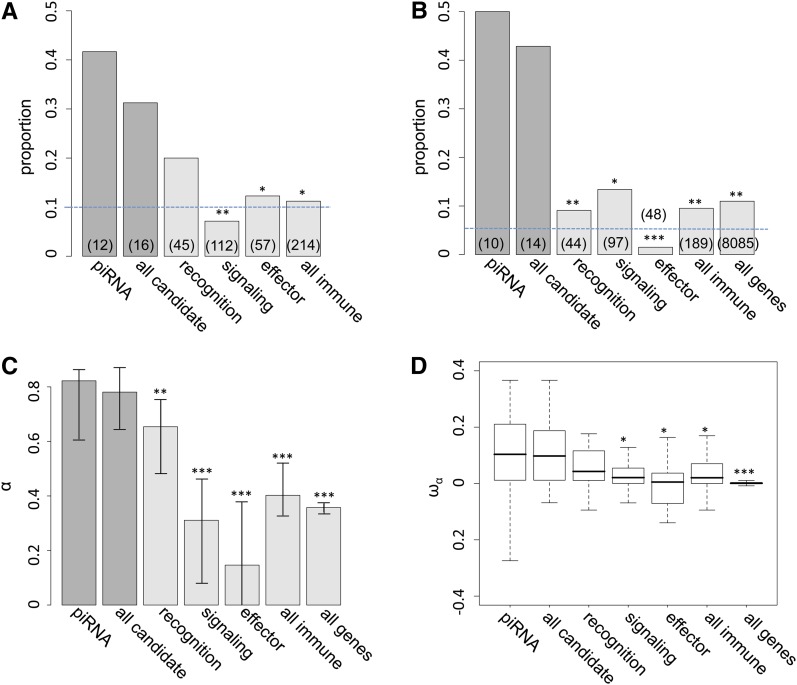
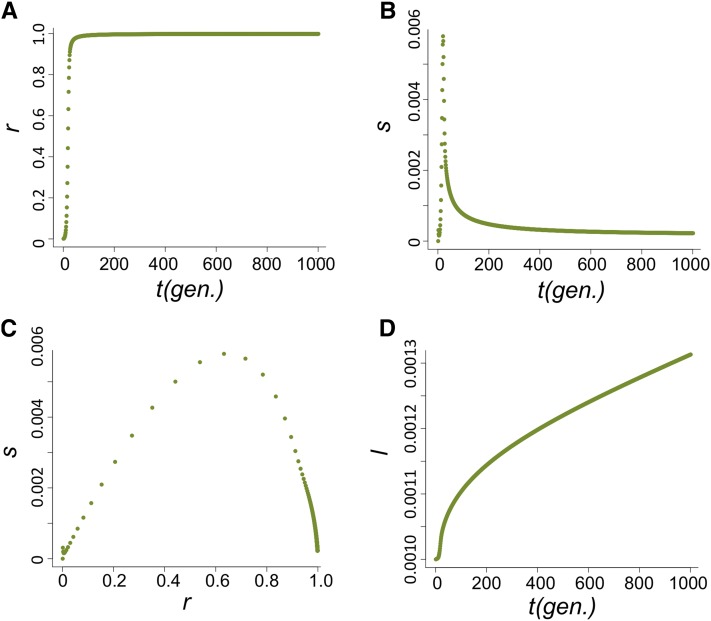
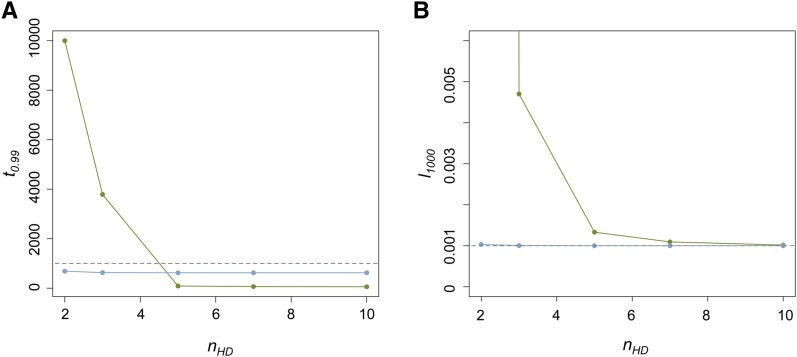
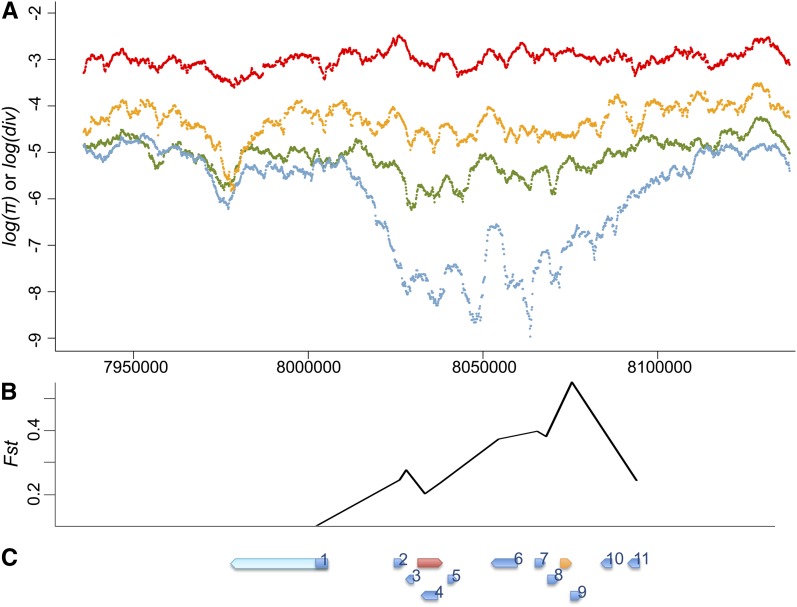
Transposable elements (TEs) are considered to be genomic parasites and their interactions with their hosts have been likened to the coevolution between host and other nongenomic, horizontally transferred pathogens. TE families, however, are vertically inherited as integral segments of the nuclear genome. This transmission strategy has been suggested to weaken the selective benefits of host alleles repressing the transposition of specific TE variants. On the other hand, the elevated rates of TE transposition and high incidences of deleterious mutations observed during the rare cases of horizontal transfers of TE families between species could create at least a transient process analogous to the influence of horizontally transmitted pathogens. Here, we formally address this analogy, using empirical and theoretical analysis to specify the mechanism of how host-TE interactions may drive the evolution of host genes. We found that host TE-interacting genes actually have more pervasive evidence of adaptive evolution than immunity genes that interact with nongenomic pathogens in Drosophila. Yet, both our theoretical modeling and empirical observations comparing Drosophila melanogaster populations before and after the horizontal transfer of P elements, which invaded D. melanogaster early last century, demonstrated that horizontally transferred TEs have only a limited influence on host TE-interacting genes. We propose that the more prevalent and constant interaction with multiple vertically transmitted TE families may instead be the main force driving the fast evolution of TE-interacting genes, which is fundamentally different from the gene-for-gene interaction of host-pathogen coevolution.


Figures

Figure 1
Figure 1
Proportion of candidate and immunity genes showing evidence of positive selection. (A) Proportions of candidate and immunity genes having D. melanogaster dN/dS among the top 10% genome-wide. (B) Proportions of candidate genes, immunity genes, and all genes having significant two-species MK tests (P-value < 0.05) and positive α. Dashed lines are the expectations assuming uniformity. The Number of genes with MK test and PAML results in each category is shown in parentheses. (C and D) Maximum-likelihood estimates of averaged α (C) and boxplots (25th, 50th, and 75th percentiles) of estimated ωα (D) for different classes of genes. Error bars represent the 95% bootstrapping intervals around each estimate. Significant comparisons between piRNA genes and other classes of genes are denoted by * (P-value <0.05), ** (P-value <0.01), and *** (P-value <0.001). Comparisons of proportions (A and B) were based on Fisher’s exact test, comparisons of maximum-likelihood estimated α (C) were based on permutations, and comparisons of ωα (D) were based on a Mann–Whitney U-test.
Figure 2
Figure 2
The dynamics of the host population during the spread of P elements. (A–D) The change of proportion of P-cytotype individuals, r (A); the selection coefficient against the nonbeneficial host allele, s (B); the relationship between s and r (C); and the allele frequency of the host beneficial allele, I (D) when u0=1 and nHD=5.
Figure 3
Figure 3
The influences of u0 and nHD on the time for near fixation of P elements and host beneficial allele frequency. (A) The generations until the P element is nearly fixed in the population (t0.99) for different u0 and nHD. Green dots are when u0 = 1 and blue dots are when u0 = 10−1. The dashed line denotes generation 1000. (B) The allele frequencies of the host beneficial allele (l1000) at generation 1000 for different u0 and nHD. The dashed line denotes 0.001, which equals l0.
Figure 4
Figure 4
Polymorphism, divergence, and temporal differentiation around Hen1. (A) Divergence between D. melanogaster and D. simulans (red), polymorphism of D. simulans (orange), polymorphism of the post–P-element African D. melanogaster population (green), and polymorphism of the post–P-element North American D. melanogaster population (blue) of 100 kb upstream and downstream of Hen1 (from 8,033,215 to 8,040,257) are shown on a log scale. There is a dramatic drop of polymorphism in the North American D. melanogaster populations around Hen1. (B and C) Temporal differentiation between pre–P- and post–P-element North American populations of control genes (B), and their relative position (C). Genes in (C) are Hen1 (red), Cyp6g1 (orange), jeb (1), CG8378 (2), CG13178 (3), CG8878 (4), CG8407 (5), Oda (6), wash (7), CG33964 (8), Cyp6t3 (9), RpS11 (10), and Sr-CII (11). Sequenced regions of each control gene are shown in blue while unsequenced regions are in light blue. The coordinates of three figures are aligned.
Figure 5
Figure 5
Divergence between D. melanogaster (D. mel) and D. willistoni (D. wil) of candidate genes among other genes. Amino acid sequence divergences were estimated for genes with an annotated D. willistoni ortholog (11 candidate genes and 10,029 other genes) and the genome-wide distribution of the divergence is shown. The divergences of the 11 candidate genes on the x-axis are shown at the bottom.
Figure A1
Figure A1
The impact of d on the allele frequency of the host beneficial allele at generation 1000 ( l1000). The dashed line is the beneficial allele frequency of host beneficial allele at generation zero (l0).
Figure A2
Figure A2
The dynamics of r (A), l (B), s (C), μ (D), and W (E) over generations when u0 = 1 and nHD = 5. (F) describes how s changes as r varies.
Figure A3
Figure A3
The dynamics of r (A), l (B), s (C), μ (D), and W (E) over generations when u0 = 1 and nHD = 2. (F) describes how s changes as r varies.
Figure A4
Figure A4
The dynamics of r (A), l (B), s (C), μ (D), and W (E) over generations when u0 = 0.1 and nHD = 5. (F) describes how s changes as r varies.

Similar articles

Cited by

References

    1. Adams M. D., Tarng R. S., Rio D. C., 1997. The alternative splicing factor PSI regulates P-element third intron splicing in vivo. Genes Dev. 11: 129–138 - PubMed
    1. Aminetzach Y. T., Macpherson J. M., Petrov D. A., 2005. Pesticide resistance via transposition-mediated adaptive gene truncation in Drosophila. Science 309: 764–767 - PubMed
    1. Andolfatto P., 2001. Contrasting patterns of X–linked and autosomal nucleotide variation in Drosophila melanogaster and Drosophila simulans. Mol. Biol. Evol. 18: 279–290 - PubMed
    1. Andolfatto P., Wong K. M., Bachtrog D., 2011. Effective population size and the efficacy of selection on the X chromosomes of two closely related Drosophila species. Genome Biol. Evol. 3: 114–128 - PMC - PubMed
    1. Anxolabéhère D., Kidwell M. G., Periquet G., 1988. Molecular characteristics of diverse populations are consistent with the hypothesis of a recent invasion of Drosophila melanogaster by mobile P elements. Mol. Biol. Evol. 5: 252–269 - PubMed

Publication types