

Neighborhood effects on the long-term well-being of low-income adults
- PMID: 22997331
- PMCID: PMC3491569
- DOI: 10.1126/science.1224648
Neighborhood effects on the long-term well-being of low-income adults
Abstract
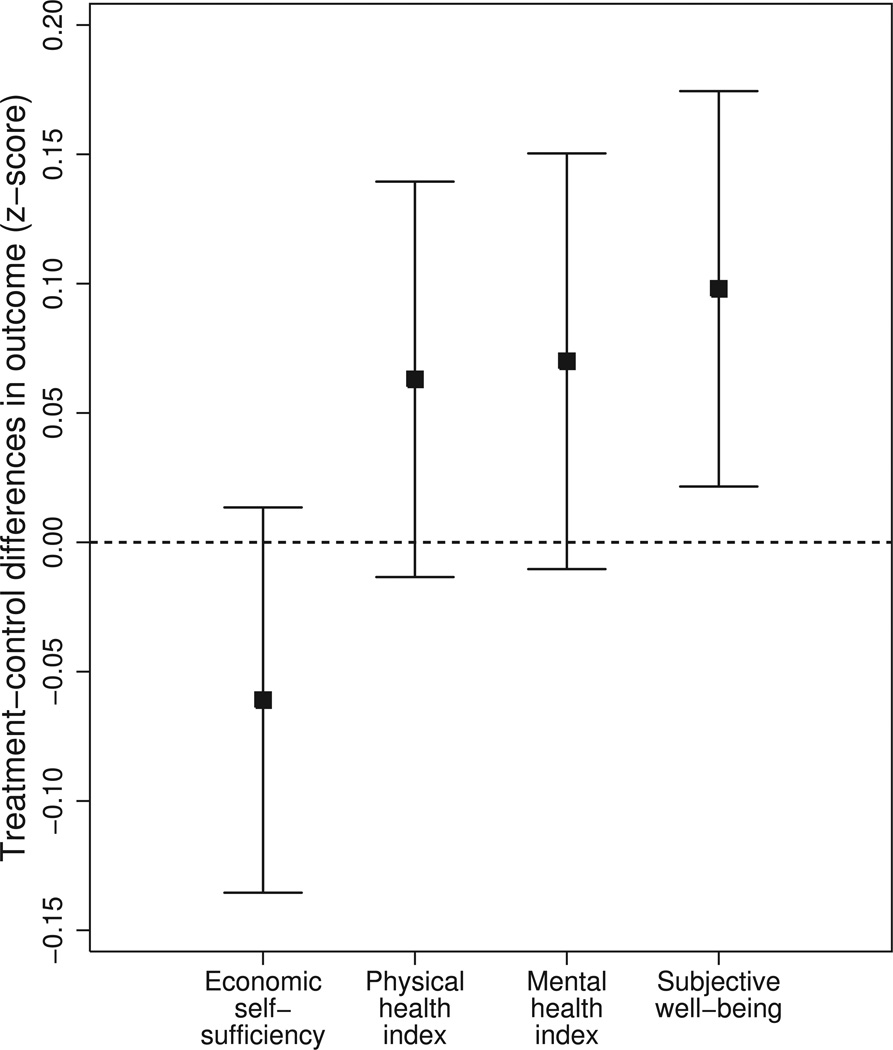
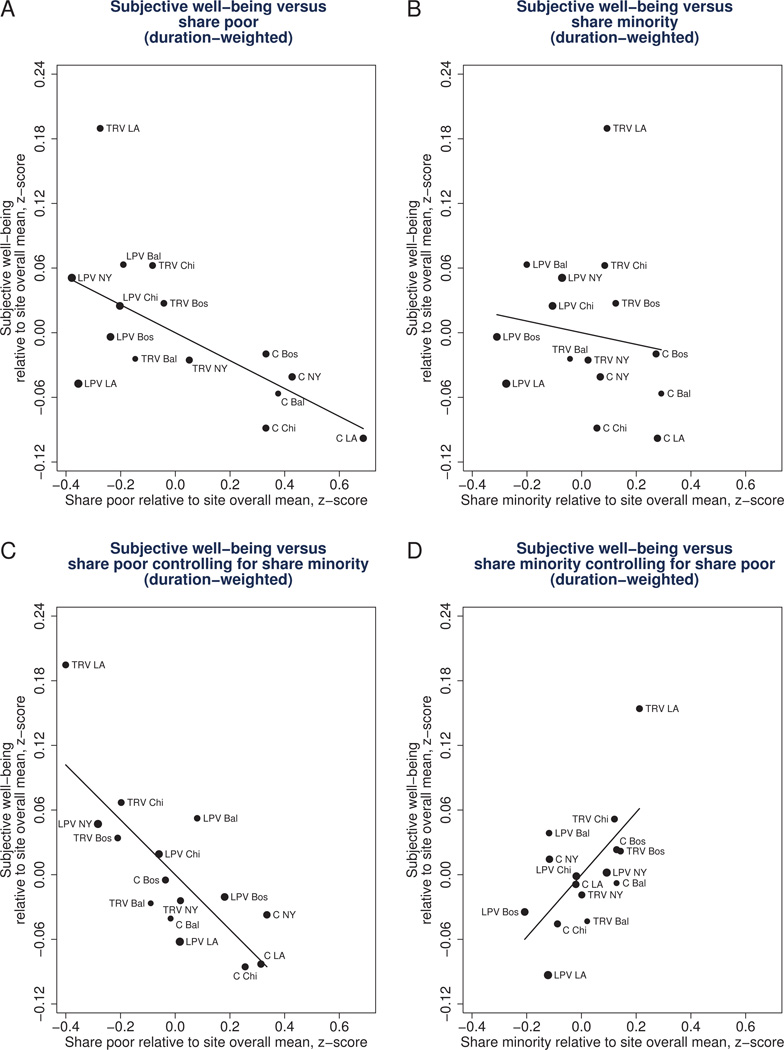
Nearly 9 million Americans live in extreme-poverty neighborhoods, places that also tend to be racially segregated and dangerous. Yet, the effects on the well-being of residents of moving out of such communities into less distressed areas remain uncertain. Using data from Moving to Opportunity, a unique randomized housing mobility experiment, we found that moving from a high-poverty to lower-poverty neighborhood leads to long-term (10- to 15-year) improvements in adult physical and mental health and subjective well-being, despite not affecting economic self-sufficiency. A 1-standard deviation decline in neighborhood poverty (13 percentage points) increases subjective well-being by an amount equal to the gap in subjective well-being between people whose annual incomes differ by $13,000--a large amount given that the average control group income is $20,000. Subjective well-being is more strongly affected by changes in neighborhood economic disadvantage than racial segregation, which is important because racial segregation has been declining since 1970, but income segregation has been increasing.
Figures
Comment in
-
Sociology. Moving and the neighborhood glass ceiling.Science. 2012 Sep 21;337(6101):1464-5. doi: 10.1126/science.1227881. Science. 2012. PMID: 22997316 No abstract available.
References
-
- Kneebone E, Nadeau C, Berube A. The Re-Emergence of Concentrated Poverty: Metropolitan Trends in the 2000s. 2011 available at http://www.brookings.edu/~/media/Files/rc/papers/2011/1103_poverty_kneeb...).
-
- U.S. Census Bureau. [accessed July 12 2012];Poverty Thresholds for 2011 by Size of Family and Number of Related Children Under 18 Years. 2012 http://www.census.gov/hhes/www/poverty/data/threshld/thresh11.xls.
-
- Sampson RJ, Raudenbush SW, Earls F. Neighborhoods and violent crime: a multilevel study of collective efficacy. Science. 1997;277:918–924. - PubMed
-
- Macintyre SA, Ellaway A. Neighborhoods and Health: An Overview. In: Kawachi I, Berkman LF, editors. Neighborhoods and Health. New York: Oxford University Press; 2003. pp. 20–42.
-
- Sampson RJ, Morenoff JD, Gannon-Rowley T. Assessing “Neighborhood Effects”: Social Processes and New Directions in Research. Annual Review of Sociology. 2002;28:443–478.
Publication types
MeSH terms
Grants and funding
- R01 MH077026/MH/NIMH NIH HHS/United States
- R01 HD040404/HD/NICHD NIH HHS/United States
- R56-AG031259/AG/NIA NIH HHS/United States
- P01-AG005842-22S1/AG/NIA NIH HHS/United States
- R01-HD040444/HD/NICHD NIH HHS/United States
- P20-AG012180/AG/NIA NIH HHS/United States
- P30 DK092949/DK/NIDDK NIH HHS/United States
- P30 AG012810/AG/NIA NIH HHS/United States
- R49-CE000906/CE/NCIPC CDC HHS/United States
- R49 CE000906/CE/NCIPC CDC HHS/United States
- R01-MH077026/MH/NIMH NIH HHS/United States
- R24-HD051152-04/HD/NICHD NIH HHS/United States
- R01 HD040444/HD/NICHD NIH HHS/United States
- R56 AG031259/AG/NIA NIH HHS/United States
- R24 HD051152/HD/NICHD NIH HHS/United States
- P01 AG005842/AG/NIA NIH HHS/United States
- R01 AG031259/AG/NIA NIH HHS/United States
- R01-HD040404/HD/NICHD NIH HHS/United States
LinkOut - more resources
Full Text Sources
Medical
Miscellaneous
