

Geomagnetic disturbances may be environmental risk factor for multiple sclerosis: an ecological study of 111 locations in 24 countries
- PMID: 22998435
- PMCID: PMC3488506
- DOI: 10.1186/1471-2377-12-100
Geomagnetic disturbances may be environmental risk factor for multiple sclerosis: an ecological study of 111 locations in 24 countries
Abstract
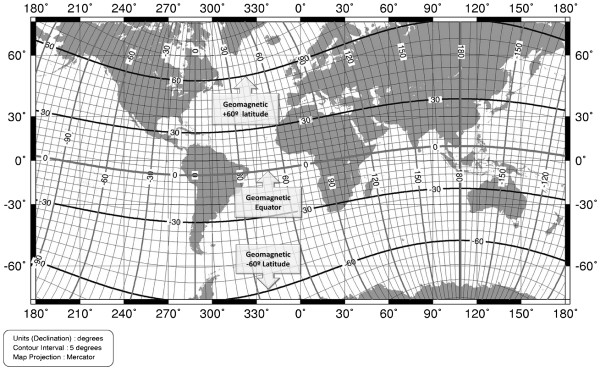
Background: We noticed that a hypothesis based on the effect of geomagnetic disturbances (GMD) has the ability to explain special features of multiple sclerosis (MS). Areas around geomagnetic 60 degree latitude (GM60L) experience the greatest amount of GMD. The easiest way to evaluate our hypothesis was to test the association of MS prevalence (MSP) with angular distance to geomagnetic 60 degree latitude (AMAG60) and compare it with the known association of MS with geographical latitude (GL). We did the same with angular distance to geographic 60 degree latitude (AGRAPH60) as a control.
Methods: English written papers with MSP keywords, done in Europe (EUR), North America (NA) or Australasia (AUS) were retrieved from the PubMed. Geomagnetic coordinates were determined for each location and AMAG60 was calculated as absolute value of numerical difference between its geomagnetic latitude from GM60L. By an ecological study with using meta-regression analyses, the relationship of MSP with GL, AMAG60 and AGRAPH60 were evaluated separately. MSP data were weighted by square root of number of prevalent cases. Models were compared by their adjusted R square (AR2) and standard error of estimate (SEE).
Results: 111 MSP data were entered in the study. In each continent, AMAG60 had the best correlation with MSP, the largest AR2 (0.47, 0.42 and 0.84 for EUR, NA and AUS, respectively) and the least SEE. Merging both hemispheres data, AMAG60 explained 56% of MSP variations with the least SEE (R = 0.75, AR2 = 0.56, SEE = 57), while GL explained 17% (R = 0.41, AR2 = 0.17, SEE = 78.5) and AGRAPH60 explained 12% of that variations with the highest SEE (R = 0.35, AR2 = 0.12, SEE = 80.5).
Conclusions: Our results confirmed that AMAG60 is the best describer of MSP variations and has the strongest association with MSP distribution. They clarified that the well-known latitudinal gradient of MSP may be actually a gradient related to GM60L. Moreover, the location of GM60L can elucidate why MSP has parabolic and linear gradient in the north and south hemisphere, respectively. This preliminary evaluation supported that GMD can be the mysterious environmental risk factor for MS. We believe that this hypothesis deserves to be considered for further validation studies.
Figures


References
-
- Kalman B. In: Neuroimmunology in Clinical Practice. Kalman B, Brannagan TH, editor. Malden: Blackwell Publishing Ltd; 2008. Multiple Sclerosis; pp. 27–82.
-
- Wallin MT, Kurtzke JF. In: Neurology in Clinical Practice. 5. Bradley WG, Daroff RB, Fenichel GM, Jankovic J, editor. Philadelphia: Butterworth-Heinemann, Elsevier; 2008. Neuroepidemiology; pp. 762–780.
MeSH terms
LinkOut - more resources
Full Text Sources
Medical
Research Materials
