. 2012 Sep 20;75(6):1081-93.
doi: 10.1016/j.neuron.2012.08.033.

Transient sodium current at subthreshold voltages: activation by EPSP waveforms

Affiliations

Transient sodium current at subthreshold voltages: activation by EPSP waveforms

Brett C Carter et al. Neuron. .

Erratum in

  • Neuron. 2015 Aug 19;87(4):906

Abstract

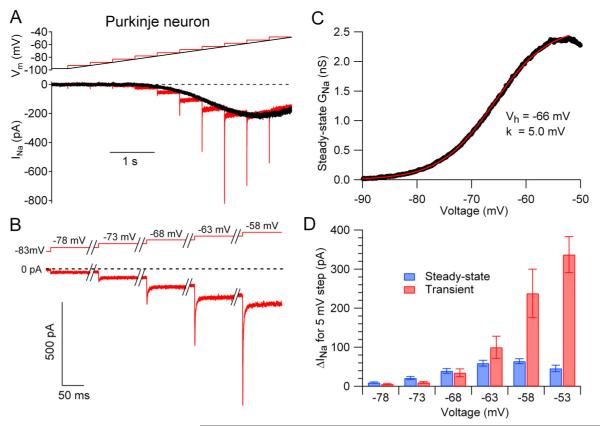
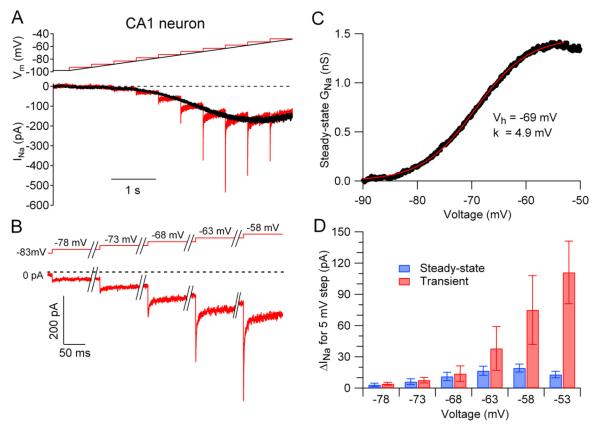
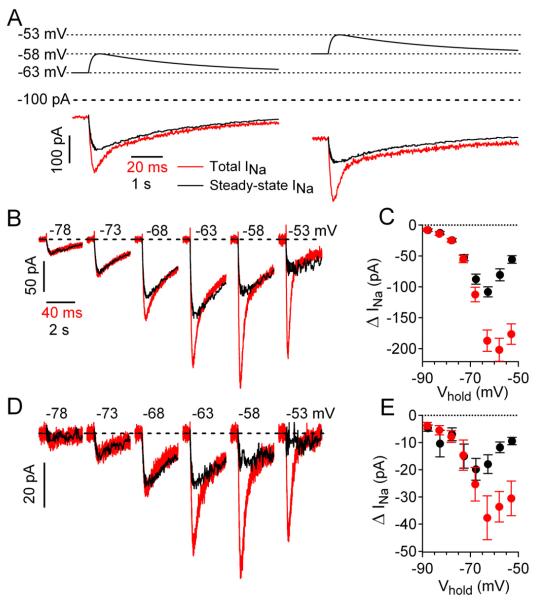
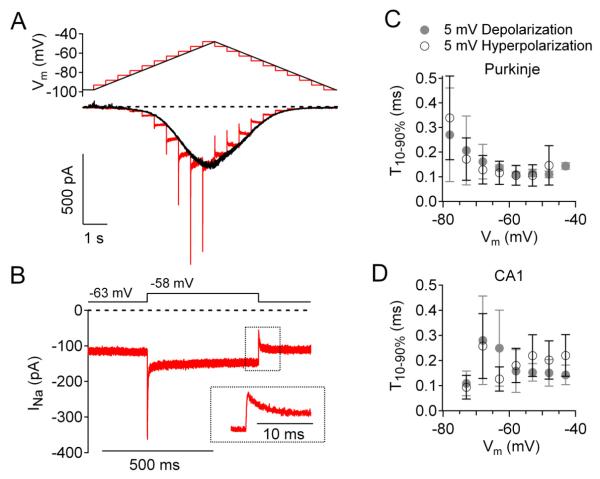
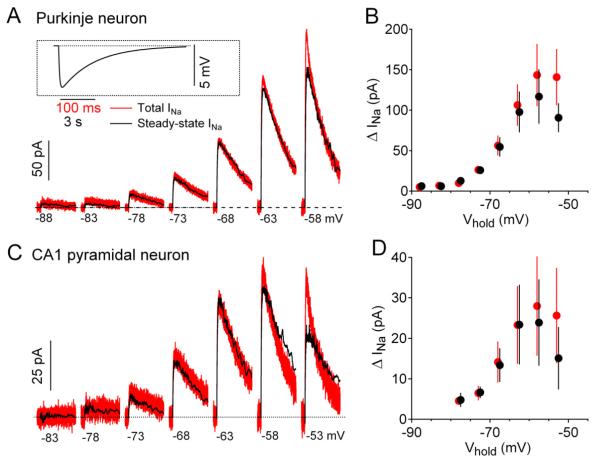
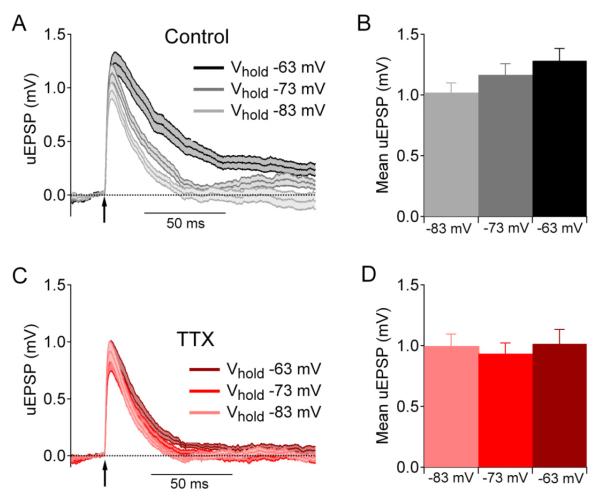
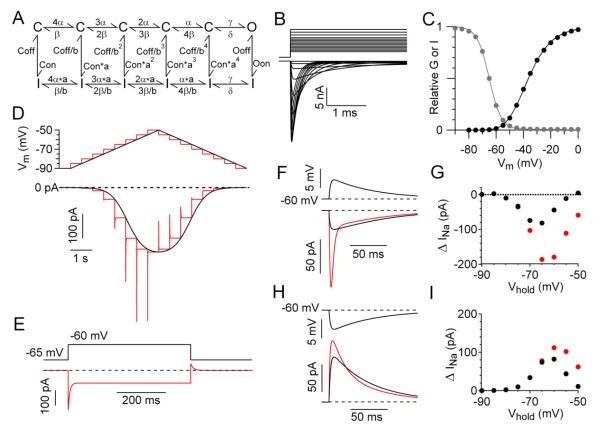
Tetrodotoxin (TTX)-sensitive sodium channels carry large transient currents during action potentials and also "persistent" sodium current, a noninactivating TTX-sensitive current present at subthreshold voltages. We examined gating of subthreshold sodium current in dissociated cerebellar Purkinje neurons and hippocampal CA1 neurons, studied at 37°C with near-physiological ionic conditions. Unexpectedly, in both cell types small voltage steps at subthreshold voltages activated a substantial component of transient sodium current as well as persistent current. Subthreshold EPSP-like waveforms also activated a large component of transient sodium current, but IPSP-like waveforms engaged primarily persistent sodium current with only a small additional transient component. Activation of transient as well as persistent sodium current at subthreshold voltages produces amplification of EPSPs that is sensitive to the rate of depolarization and can help account for the dependence of spike threshold on depolarization rate, as previously observed in vivo.


Figures

Figure 1
Figure 1. Transient and steady-state sodium current at subthreshold voltages in a Purkinje neuron
(A) TTX-sensitive sodium current in a cerebellar Purkinje neuron evoked by a slow (10 mV/s) ramp from −98 to −48 mV (black trace) and by a staircase series of 500-msec 5-mV steps at the same overall rate of depolarization (red traces). (B) Initial segments of staircase-evoked sodium currents shown on a faster time base, illustrating component of transient current. (C) Voltage-dependence of steady-state sodium conductance calculated from the ramp current in A (black), fit with a Boltzmann function (red). (D) Collected results, comparing the change in steady-state sodium current (blue) with the transient component of current (red) for 5-mV depolarizing steps to various voltages in the subthreshold range. Bars indicate mean ± SEM for measurements in 10 Purkinje neurons.
Figure 2
Figure 2. Transient and steady-state sodium current at subthreshold voltages in CA1 pyramidal neurons
(A) TTX-sensitive sodium current in a CA1 pyramidal neuron evoked by a slow (10 mV/s) ramp from −98 to −48 mV (black trace) and by a staircase series of 500-msec 5-mV steps (red traces). (B) Initial segments of staircase-evoked sodium currents showing transient current. (C) Voltage-dependence of steady-state sodium conductance calculated from the ramp current in A (black), fit with a Boltzmann function (red). (D) Collected results for CA1 pyramidal neurons, comparing the change in steady-state sodium current (blue) with the transient component of current (red) for 5-mV depolarizing steps to various voltages. Bars indicate mean ± SEM for measurements in 11 neurons.
Figure 3
Figure 3. TTX-sensitive sodium current evoked by EPSP-like waveforms in Purkinje neurons and CA1 pyramidal neurons
(A) TTX-sensitive sodium current in a Purkinje neuron elicited by a 5-mV EPSP-like voltage command (red traces) or by the same command slowed by a factor of 50 to evoke only steady-state current (black traces). EPSP waveforms were delivered from holding potentials of either −63 mV (left) or −58 mV (right). (B) TTX-sensitive current in a Purkinje neuron evoked from various holding potentials by the real-time EPSP waveform (red traces) compared with steady-state sodium current (black traces). Each trace is plotted with an offset corresponding to the steady sodium current at the holding potential (before the EPSP waveform), so that steady sodium current at each holding potential is on the same horizontal line; steady sodium currents were −17 pA at −78 mV, −42 pA at −73 mV, −84 pA at −68 mV,-161 pA at −63 mV, −239 pA at −58 mV, and −280 pA at −53 mV. (C) Summary of Purkinje neuron data for peak change in sodium current during EPSP-like waveforms evoked from different holding potentials. Red symbols are the mean ± SEM peak total evoked sodium current, black symbols are mean ± SEM steady-state sodium current (n=6-8). (D) EPSP-like voltage changes elicit transient and steady-state components of sodium current in CA1 neurons. Steady sodium currents (offsets) were −1 pA at −78 mV, −3 pA at −73 mV, −10 pA at −68 mV,-23 pA at −63 mV, −29 pA at −58 mV, and −30 pA at −53 mV. (E) Summary of CA1 neuron data for peak change in sodium current during EPSP-like waveforms evoked from different holding potentials. Red symbols are the mean ± SEM peak total evoked sodium current, black symbols are mean ± SEM steady-state sodium current (n=8-14).
Figure 4
Figure 4. Kinetics of activation and deactivation of subthreshold sodium current
(A) Currents evoked in a Purkinje neuron by upward followed by downward staircase protocols (red) and steady-state current evoked by a slow ramp (10 mV/s) in both directions. (B) Sodium current evoked by a 500-ms step from −63 to −58 mV and back (same neuron as A). Inset: Current during step from −58 to −63 mV shown at faster time base, showing rapid deactivation followed by partial recovery from inactivation. (C) Time required for 10-90% change in sodium current in response to 5-mV depolarizations (filled symbols) and hyperpolarizations (open symbols) in Purkinje neurons (mean ± SEM, n=3-6) for steps to the indicated voltage. (D) Time required for 10-90% change in sodium current in response to 5-mV depolarizations (filled symbols) and hyperpolarizations (open symbols) in CA1 pyramidal neurons (mean ± SEM, n=3-7).
Figure 5
Figure 5. TTX-sensitive sodium current evoked by IPSP-like waveforms in Purkinje neurons and CA1 pyramidal neurons
(A) TTX-sensitive sodium current elicited in a Purkinje neuron by a 5-mV IPSP-like hyperpolarizing voltage command delivered from various holding potentials (red traces) or by the same command slowed by a factor of 50 to evoke only steady-state sodium current (black trace). Each trace is plotted with an offset corresponding to the steady sodium current at the holding potential (before the IPSP waveform), so that steady sodium current at each holding potential is on the same horizontal line; steady sodium currents were 0 pA at −88 mV, +1 at −83 mV,-25 pA at −78 mV, −58 pA at −73 mV, −129 pA at −68 mV,-264 pA at −63 mV, and −385 pA at −58 mV. (B) Summary of Purkinje neuron data for peak change in sodium current during IPSP-like waveforms evoked from different holding potentials. Red symbols are the mean ± SEM peak total evoked sodium current, black symbols are mean ± SEM steady-state sodium current (n=4). (C) IPSP-like voltage waveforms elicit transient and steady-state components of sodium current in CA1 neurons similar to those in Purkinje neurons. Steady sodium currents (offsets) were 0 at −83 mV, −4 pA at −78 mV, −18 pA at −73 mV, −47 pA at −68 mV,-89 pA at −63 mV, −126 pA at −58 mV, and −126 pA at −53 mV. (D) Summary of CA1 neuron data for peak change in sodium current during IPSP-like waveforms evoked from different holding potentials. Red symbols are the mean ± SEM peak total evoked sodium current, black symbols are mean ± SEM steady-state sodium current (n=5).
Figure 6
Figure 6. Somatic voltage changes evoked by 2-photon uncaging of glutamate at single spines of CA1 pyramidal neurons
(A) uEPSPs recorded in control solutions using holding potentials of −83 mV (light gray), −73 mV (dark gray) or −63 mV (black). Traces plot mean ± SEM for recordings from 5-7 spines. (B) Peak uEPSP voltage from the different holding potentials in control solutions (mean ± SEM). (C,D) Same for uEPSPs recorded in the presence of 1 μM TTX (mean ± SEM).
Figure 7
Figure 7. Characteristics of steady-state and transient subthreshold sodium current are predicted in an allosteric model of sodium channel gating
(A) Model of sodium channel gating. Activation occurs with voltage-dependent transitions between multiple closed states (top row) with strongly voltage-dependent rate constants (α=250*exp(V/24) msec−1, β=12*exp(−V/24) msec−1), considered to correspond to movement of S4 gating regions, followed by a non-voltage-dependent opening transition (γ=250 msec−1, δ= 60 msec−1). Inactivation corresponds to vertical transitions. Inactivation is slow and weak when channels have not activated (Con=0.01 msec−1, Coff=2 msec−1) and becomes faster and more complete in a manner allosterically linked to the extent of activation. The allosteric relationship is expressed by the scaling constants a (2.51) and b (5.32). Inactivation from the open state is fast (Oon=8 msec−1 and with a slow off-rate (Ooff=0.05 msec−1) such that open state inactivation is ~99.4% complete. Microscopic reversibility is ensured by the reciprocal allosteric relationship between activation and inactivation rates for steps corresponding to movement of S4 regions. (B) Predicted transient currents elicited by steps from a holding potential of −90 mV to a series of voltages from −60 to 0 mV. C) Voltage-dependence of activation (filled circles, relative peak conductance during a 30-msec step) and steady-state availability (open circles). Relative peak conductance was normalized to peak conductance for a step to +30 mV and is fit (black line) by a Boltzmann function raised to the 4th power, (1/(1+exp(−(V+54.1))/10.7)^4. Steady-state availability is fit (gray line) by a first-order Boltzmann function curve, (1/(1+exp(V+65)/4.3). (D) Predictions of the model for 10 mV/s ramp (black trace) and 5-mV staircase (red trace) voltage protocols. (E) Predictions of the model for sodium current elicited by a 500 ms step from −65 mV to −60 mV and back to −65 mV. Dashed line corresponds to steady-state current at −65 mV (−121 pA). (F) Predictions of the model for activation by an EPSP waveform of transient plus steady-state sodium current (red trace) compared to steady-state current alone (black), calculated from the predicted steady-state current at each voltage. (G) Peak steady-state (black symbols) and total (red symbols) sodium current predicted by the model in response to 5-mV EPSP waveforms delivered from a range of holding potentials. (H) Predictions of the model for activation by an IPSP waveform of transient plus steady-state sodium current (red trace) compared to steady-state current alone (black). (I) Peak steady-state (black symbols) and total (red symbols) sodium current predicted by the model in response to IPSP waveforms delivered from a range of holding potentials.

References

    1. Agrawal N, Alonso A, Ragsdale DS. Increased persistent sodium currents in rat entorhinal cortex layer V neurons in a post-status epilepticus model of temporal lobe epilepsy. Epilepsia. 2003;44:1601–1604. - PubMed
    1. Alzheimer C, Schwindt PC, Crill WE. Modal gating of Na+ channels as a mechanism of persistent Na+ current in pyramidal neurons from rat and cat sensorimotor cortex. J Neurosci. 1993;13:660–673. - PMC - PubMed
    1. Aman TK, Raman IM. Subunit dependence of Na channel slow inactivation and open channel block in cerebellar neurons. Biophys J. 2007;92:1938–1951. - PMC - PubMed
    1. Aman TK, Raman IM. Inwardly permeating Na ions generate the voltage dependence of resurgent Na current in cerebellar Purkinje neurons. J Neurosci. 2010;30:5629–5634. - PMC - PubMed
    1. Andreasen M, Lambert JD. Somatic amplification of distally generated subthreshold EPSPs in rat hippocampal pyramidal neurones. J Physiol. 1999;519(Pt 1):85–100. - PMC - PubMed

Publication types

MeSH terms

LinkOut - more resources