

Focal microdialysis of CO₂ in the perifornical-hypothalamic area increases ventilation during wakefulness but not NREM sleep
- PMID: 22999917
- PMCID: PMC3530002
- DOI: 10.1016/j.resp.2012.09.007
Focal microdialysis of CO₂ in the perifornical-hypothalamic area increases ventilation during wakefulness but not NREM sleep
Abstract
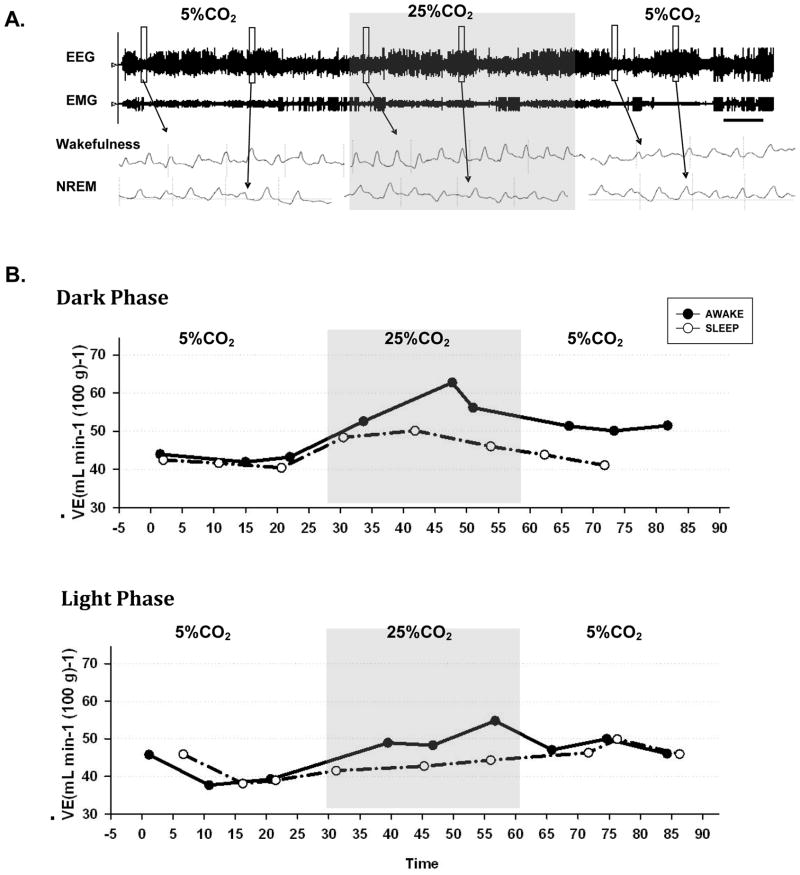
We investigated whether the perifornical-lateral hypothalamic area (PF-LHA), where the orexin neurons reside, is a central chemoreceptor site by microdialysis of artificial cerebrospinal fluid (aCSF) equilibrated with 25% CO(2) into PF-LHA in conscious rats. This treatment is known to produce a focal tissue acidification like that associated with a 6-7 mm Hg increase in arterial [Formula: see text] . Such focal acidification in the PF-LHA significantly increased ventilation up to 15% compared with microdialysis of normal aCSF equilibrated with 5% CO(2) only in wakefulness but not in sleep in both the dark (P=0.004) and light (P<0.001) phases of the diurnal cycle. This response was predominantly due to a significant increase in respiratory frequency (11%, P<0.001). There were no significant effects on ventilation in the group with probes misplaced outside the PF-LHA. These results suggest that PF-LHA functions as a central chemoreceptor site in the central nervous system in a vigilant state dependent manner with predominant effects in wakefulness.
Copyright © 2012 Elsevier B.V. All rights reserved.
Figures


Similar articles
-
Sleep-wake and diurnal modulation of nitric oxide in the perifornical-lateral hypothalamic area: real-time detection in freely behaving rats.Neuroscience. 2013 Dec 19;254:275-84. doi: 10.1016/j.neuroscience.2013.09.022. Epub 2013 Sep 19. Neuroscience. 2013. PMID: 24056193
-
A1 receptor mediated adenosinergic regulation of perifornical-lateral hypothalamic area neurons in freely behaving rats.Neuroscience. 2010 Apr 28;167(1):40-8. doi: 10.1016/j.neuroscience.2010.01.044. Epub 2010 Jan 28. Neuroscience. 2010. PMID: 20109537 Free PMC article.
-
The orexin receptor 1 (OX1R) in the rostral medullary raphe contributes to the hypercapnic chemoreflex in wakefulness, during the active period of the diurnal cycle.Respir Physiol Neurobiol. 2010 Jan 31;170(1):96-102. doi: 10.1016/j.resp.2009.12.002. Epub 2009 Dec 6. Respir Physiol Neurobiol. 2010. PMID: 19995618 Free PMC article.
-
[Hypothalamic neuropeptides implicated in the regulation of sleep/wakefulness states].Brain Nerve. 2012 Jun;64(6):629-37. Brain Nerve. 2012. PMID: 22647470 Review. Japanese.
-
Hypothalamic regulation of the sleep/wake cycle.Neurosci Res. 2017 May;118:74-81. doi: 10.1016/j.neures.2017.03.013. Epub 2017 May 17. Neurosci Res. 2017. PMID: 28526553 Review.
Cited by
-
Activation of the brain melanocortin system is required for leptin-induced modulation of chemorespiratory function.Acta Physiol (Oxf). 2015 Apr;213(4):893-901. doi: 10.1111/apha.12394. Epub 2014 Sep 30. Acta Physiol (Oxf). 2015. PMID: 25207799 Free PMC article.
-
Orexin Neurons Contribute to Central Modulation of Respiratory Drive by Progestins on ex vivo Newborn Rodent Preparations.Front Physiol. 2019 Sep 27;10:1200. doi: 10.3389/fphys.2019.01200. eCollection 2019. Front Physiol. 2019. PMID: 31611806 Free PMC article.
-
Regulation of breathing and autonomic outflows by chemoreceptors.Compr Physiol. 2014 Oct;4(4):1511-62. doi: 10.1002/cphy.c140004. Compr Physiol. 2014. PMID: 25428853 Free PMC article. Review.
-
Hypoxia silences retrotrapezoid nucleus respiratory chemoreceptors via alkalosis.J Neurosci. 2015 Jan 14;35(2):527-43. doi: 10.1523/JNEUROSCI.2923-14.2015. J Neurosci. 2015. PMID: 25589748 Free PMC article.
-
Lateral hypothalamus as a sensor-regulator in respiratory and metabolic control.Physiol Behav. 2013 Sep 10;121:117-24. doi: 10.1016/j.physbeh.2013.03.023. Epub 2013 Apr 3. Physiol Behav. 2013. PMID: 23562864 Free PMC article. Review.
References
-
- Bartlett D, Jr, Tenney SM. Control of breathing in experimental anemia. Respiration physiology. 1970;10:384–395. - PubMed
-
- Biancardi V, Bicego KC, Almeida MC, Gargaglioni LH. Locus coeruleus noradrenergic neurons and CO2 drive to breathing. Pflugers Archiv: European journal of physiology. 2008;455:1119–1128. - PubMed
-
- Coates EL, Li A, Nattie EE. Widespread sites of brain stem ventilatory chemoreceptors. J Appl Physiol. 1993;75:5–14. - PubMed
-
- Cross BA, Silver IA. Unit activity in the hypothalamus and the sympathetic response to hypoxia and hypercapnia. Experimental neurology. 1963;7:375–393. - PubMed
Publication types
MeSH terms
Substances
Grants and funding
LinkOut - more resources
Full Text Sources
Other Literature Sources
