. 2012 Dec 13:226:165-77.
doi: 10.1016/j.neuroscience.2012.09.028. Epub 2012 Sep 19.

Periaqueductal gray neuroplasticity following chronic morphine varies with age: role of oxidative stress

Affiliations

Periaqueductal gray neuroplasticity following chronic morphine varies with age: role of oxidative stress

D Bajic et al. Neuroscience. .

Abstract

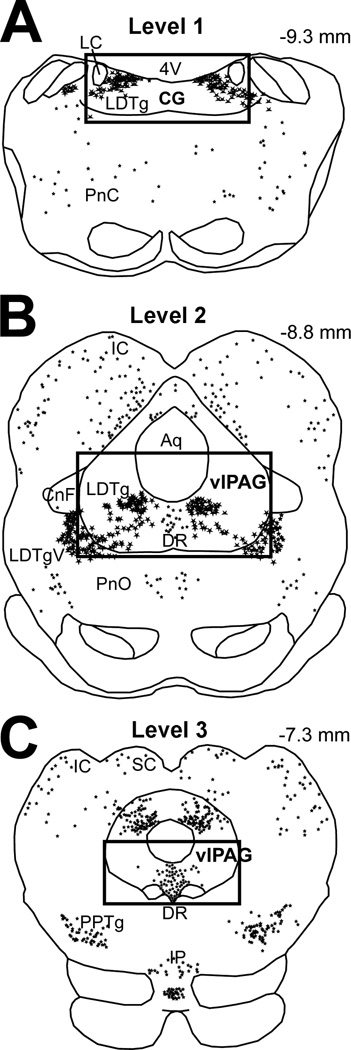
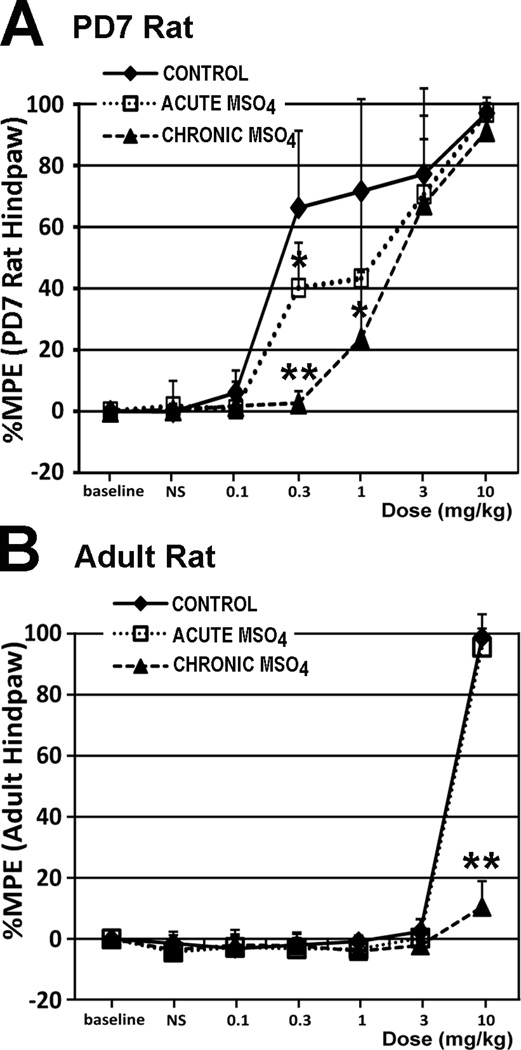
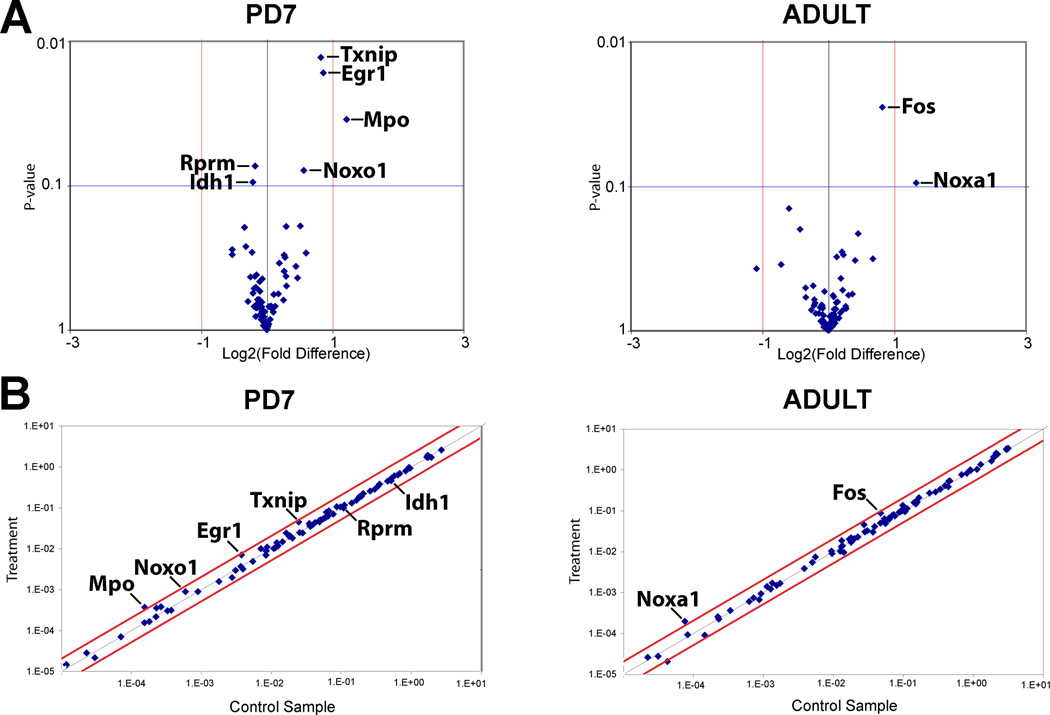
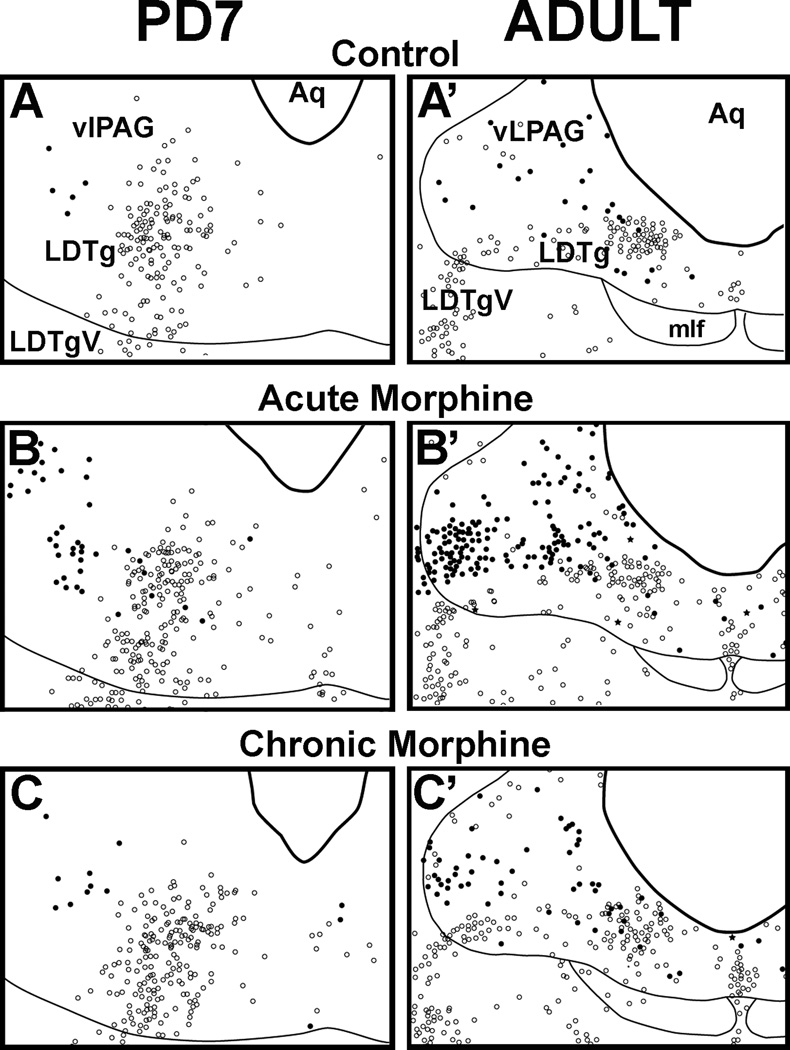
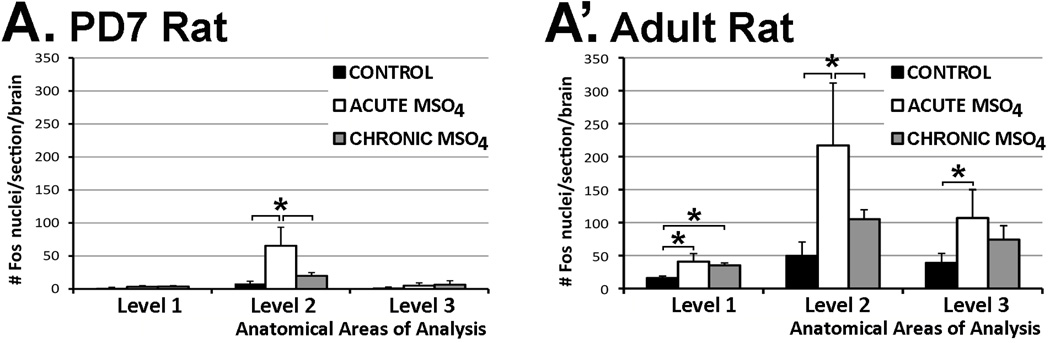
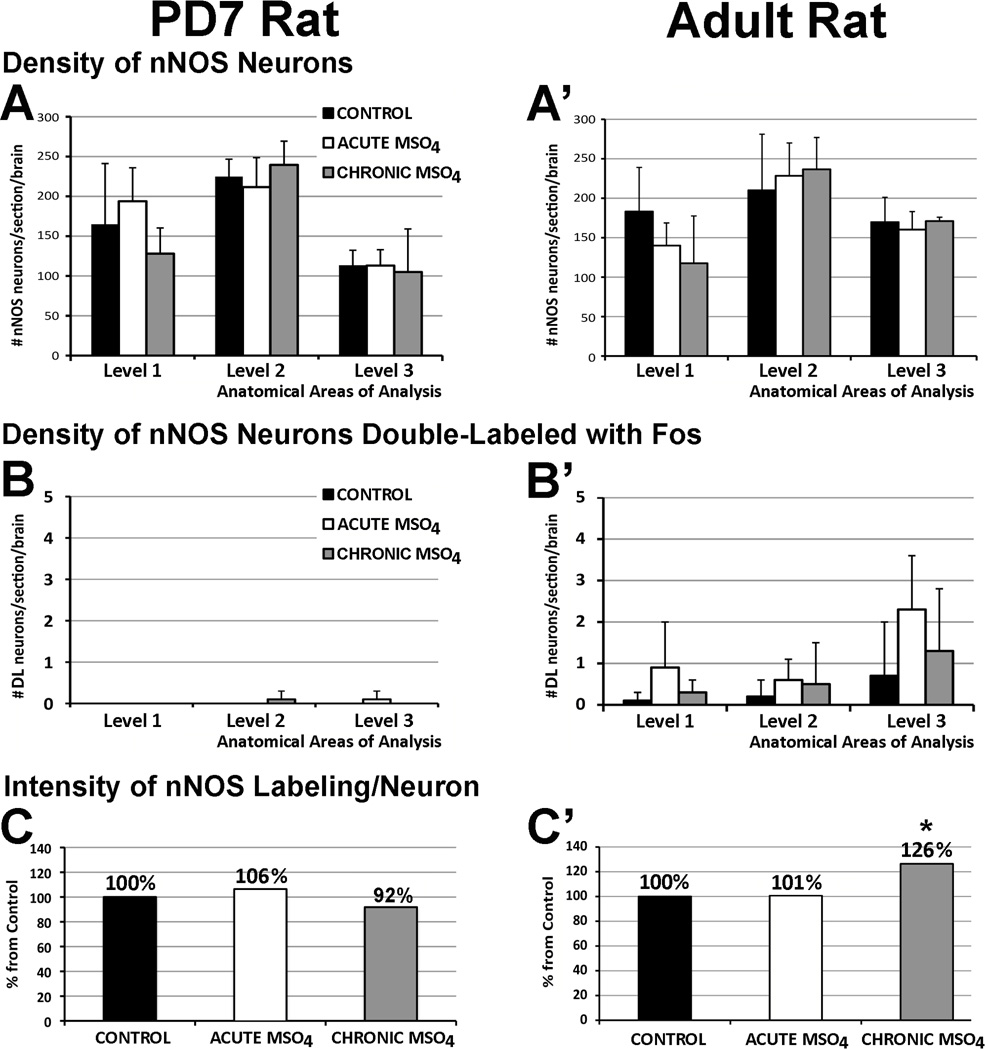
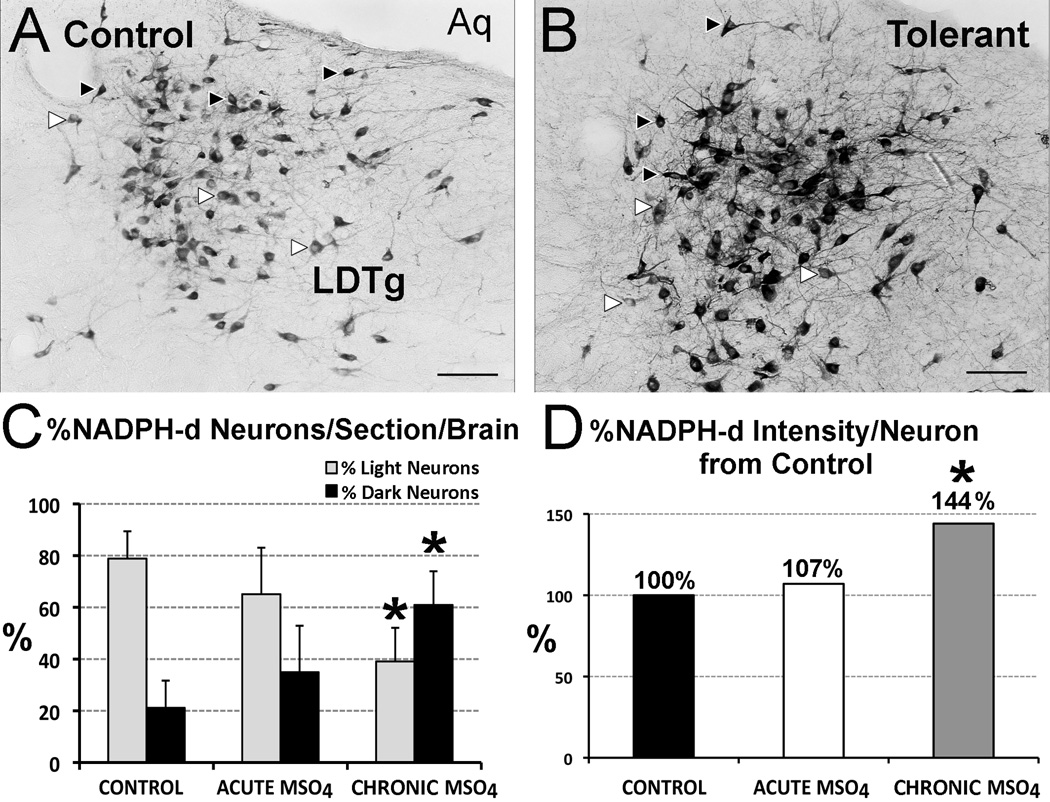
The development of tolerance to the antinociceptive effects of morphine has been associated with networks within ventrolateral periaqueductal gray (vlPAG) and separately, nitric oxide signaling. Furthermore, it is known that the mechanisms that underlie tolerance differ with age. In this study, we used a rat model of antinociceptive tolerance to morphine at two ages, postnatal day (PD) 7 and adult, to determine if changes in the vlPAG related to nitric oxide signaling produced by chronic morphine exposure were age-dependent. Three pharmacological groups were analyzed: control, acute morphine, and chronic morphine group. Either morphine (10mg/kg) or equal volume of normal saline was given subcutaneously twice daily for 6½ days. Animals were analyzed for morphine dose-response using Hot Plate test. The expression of several genes associated with nitric oxide metabolism was evaluated using rtPCR. In addition, the effect of morphine exposure on immunohistochemistry for Fos, and nNOS as well as nicotinamide adenine dinucleotide phosphate diaphorase (NADPH-d) reaction at the vlPAG were measured. In both age groups acute morphine activated Fos in the vlPAG, and this effect was attenuated by chronic morphine, specifically in the vlPAG at the level of the laterodorsal tegmental nucleus (LDTg). In adults, but not PD7 rats, chronic morphine administration was associated with activation of nitric oxide function. In contrast, changes in the gene expression of PD7 rats suggested superoxide and peroxide metabolisms may be engaged. These data indicate that there is supraspinal neuroplasticity following morphine administration as early as PD7. Furthermore, oxidative stress pathways associated with chronic morphine exposure appear age-specific.


Conflict of interest statement

CONFLICT OF INTEREST STATEMENT

There are no conflicts of interest.

Figures

Figure 1
Figure 1. Schematic Representation of Areas of Analysis
Schematic drawings of adult rat brain coronal brainstem sections illustrate distribution of neuronal nitric oxide synthase (nNOS) immunoreactive neurons that are represented as stars. Differences in star size reflect differences in the size of individual nNOS neurons. Anatomical areas of analysis are marked by a square: (A) Level 1 encompasses the central gray (CG) at the level of the rostral locus coeruleus (LC; corresponding to plates 56–59 of the adult rat brain atlas (Paxinos and Watson, 1998)), (B) Level 2 includes the ventrolateral periaqueductal gray (vlPAG) at the level of the inferior colliculus (IC) (corresponding to Plates 53–55), and (C) Level 3 includes the vlPAG at the level of the superior colliculus (SC) (corresponding to Plates 48–52). Large nNOS immunoreactive neurons are located within the laterodorsal tegmental nucleus (LDTg) at levels 1 and 2. Abbreviations: 4V, fourth ventricle; Aq, aqueduct (Sylvius); CnF, cuneiform nucleus; DR, dorsal raphe nucleus; IP, interpeduncular nucleus; LDTgV; laterodorsal tegmental nucleus, ventral part; PnC; pontine reticular nucleus, caudal part; PnO, pontine reticular nucleus, oral part; PPTg, pedunculopontine tegmental nucleus. Numbers in the upper right corner represent distance from Bregma.
Figure 2
Figure 2. Behavioral Analysis of Morphine Antinociceptive Effects
Hot Plate testing was done on the 7th day of treatment to evaluate development of antinociceptive tolerance (n=6/pharmacological group/age, except for n=7 for chronic morphine group in postnatal day (PD)7 rat). We used 49°C (with 20 s cutoff latency) for PD7 rats, and 56°C (with 12 s cutoff latency) for adult rats. Thus, morphine potency cannot be compared between two age groups. Chronic morphine treatment rendered both the the PD7 (F(2,16)=24.74; p<0.001 at 0.3 mg/kg testing dose) and adult rat (F(2,15)=228.9; p<0.001 at 10 mg/kg testing dose) tolerant to morphine’s antinociceptive effects. Results are presented as a percentage of maximum possible effect (%MPE ± SD) according to the method of Harris and Pierson (Harris and Pierson, 1964) to construct dose-response curves for morphine’s antinociceptive effect. Panel A: In the PD7 rat, a morphine dose of 0.3 mg/kg showed evidence of tolerance development in the chronic morphine group (%MPE= 2.67± 3.87), in comparison to both control (66.24% ± 25.08; p<0.01) and acute morphine (40.19% ± 14.68; p<0.01) groups. Interestingly, the same morphine dose of 0.3 mg/kg led to a statistically significant decrease in %MPE of the acute morphine group versus control group (p<0.05), suggesting that even a single prior exposure to morphine attenuates its antinociceptive effect at this early age. Furthermore, a 1 mg/kg morphine test dose led to a statistically significant difference (F(2,16)=5.17; p=0.01) only between the control and chronic morphine group (p<0.05). Panel B: In the adult rat, a morphine dose of 10 mg/kg led to significantly lower %MPE in the chronic morphine group (10.46% ± 8.45), in comparison to control (98.81% ± 2.91; p<0.01) and acute morphine (95.58% ± 10.8; p<0.01) groups. Abbreviations: MSO4, morphine; **, p<0.01; *, p<0.05.
Figure 3
Figure 3. Gene Expression Analysis at the Ventral Periaqueductal Gray
Total of 84 genes were assayed using Rat Nitric Oxide Signaling Pathway PCR Array (PARN-062; SABiosciences™) in in the ventral periaqueductal gray at the level of the inferior colliculus (see also Fig. 1B). Gene expression was compared between treatment (chronic morphine) and control (chronic normal saline administration) at two different ages of the rat: postnatal day (PD)7 and adult. (A) Volcano plots illustrate relationship between the gene expression fold change and p-value for all the morphine tolerant and control pairs. Those with p < 0.1 for treatment effect are indicated. (B) Scatter plots for all of the genes assayed illustrating the relative abundance in control and chronic morphine treated conditions. X and Y axis in Panel B correspond to 2^-ΔCt [Ct(gene of interest)-Avg Ct (housekeeping gene, HKG]. Abbreviations of genes: Egr1, Early growth response 1; Fos, FBJ osteosarcoma oncogene; Idh1, isocitrate dehydrogenase 1 (NADP+), soluble; MPO, myeloperoxidase; Noxa1, NADPH oxidase activator 1; Noxo1, NADPH oxidase organizer 1; Txnip, thioredoxin interacting protein.
Figure 4
Figure 4. Anatomical Distribution of Fos-Immunoreactive Nuclei and nNOS-Immunoreactive Neurons in the Rostral Brainstem in PD7 and Adult Rats
Schematic drawings illustrate distribution of Fos and nNOS immunolabeling following normal saline (control, A and A’), acute morphine (B and B’), and chronic morphine treatments (C and C’) at the ventrolateral periaqueductal gray (vlPAG) at the level of the inferior colliculus (see also Fig. 1B; Level 2). Distribution of Fos nuclei and nNOS neurons is represented as black dots and open circles, respectively. Very few double-labeled neurons were labeled as black stars. Fine lines mark some anatomical landmarks. Abbreviations: Aq, cerebral aqueduct; LDTg, laterodorsal tegmental nucleus; LDTgV; laterodorsal tegmental nucleus, ventral part; mlf, medial longitudinal fasciculus.
Figure 5
Figure 5. Distribution and Density of Fos Immunolabeling with Morphine Treatment
Graphs show average density (#Fos/section/brain ± SD) of Fos-immunoreactive nuclei following different pharmacological treatments: control, acute morphine, and chronic morphine administration in (A) PD7 and (A’) the adult rat. Three different brain regions were analyzed (shown in Fig. 1). Panel A: In the PD7 rat, statistically significant differences in Fos density among treatments are found only at Level 2 of the vlPAG at the inferior colliculus (F(2,12)=16.82; p<0.001) with a significant effect of acute morphine treatment on the number of Fos nuclei when compared to both the control (p<0.01) and chronic morphine group (p<0.01). No changes were found either caudally (Level 1; F(2,9)=2.09; p=0.179) or rostrally (Level 3; F(2,10)=1.06; p=0.382). Panel A’: In the adult rat, statistically significant differences in estimated density among three different experimental groups were found in all three anatomical regions of analysis: Level 1 (F(2,12)=14.96; p<0.001), Level 2 (F(2,12)=11.41; p<0.01), and Level 3 (F(2,12)=7.04; p<0.01). At Level 1, density of Fos-immunoreactive nuclei was significantly higher between both acute and chronic morphine groups in comparison to control (p<0.01), but there were no differences between acute and chronic morphine groups. At Level 2, we showed significant increase in estimated density of Fos nuclei in the acute morphine group in comparison to both control (p<0.01) and chronic morphine groups (p<0.05). At Level 3, the acute morphine group was only different from control (p<0.01) but not from the chronic morphine group.
Figure 6
Figure 6. Density of Neuronal Nitric Oxide Synthase (nNOS) Neurons in Ventral Periaqueductal Gray with Pharmacological Treatment
Graphs in Panels A and A’ show average density (#profiles/section/brain ± SD) of nNOS immunoreactive neurons, while Panels B and B’ show average density of nNOS neurons double-labeled (DL) with Fos following different pharmacological treatment: control, acute morphine, and chronic morphine both in the PD7 (A and B) and the adult rat (A’ and B’). There was no statistically significant difference in density of nNOS neurons in different anatomical regions following different pharmacological treatment for either PD7 or adult rat. Very few double-labeled neurons (nNOS neurons with Fos nuclei) were identified in the adult rat that did not change among the different treatment groups. Double-labeling in the PD7 rat was negligible. (C and C’) Average intensity of nNOS immunolabeling per individual neuron in the cluster of nNOS immunoreactive neurons with treatment. Region of analysis included nNOS neurons at inferior colliculus (shown in Fig. 1B) of PD7 and the adult rat. No changes were found in PD7 rats among different treatment (F(2, 12)=0.59, p=0.57; C). In the adult rat, percent (%) increase from control of average intensity of nNOS immunoreactive labeling per neuron in chronic morphine group was significantly increased (26%; F(2,15)=10.4; p=0.001; C’) when compared to control (p=0.02) and acute morphine groups (p=0.02). Asterisk (*) indicates p<0.05, significant difference.
Figure 7
Figure 7. NADPH-d Histochemistry Reaction of the Adult Rat
Representative images of NADPH-d staining in the laterodorsal tegmental nucleus (LDTg) in adult rats treated with chronic injections of normal saline (control; A) versus chronic morphine (tolerant; B). Examples of lightly labeled neurons are marked with white arrow, while dark ones are indicated with black arrows. Total number of labeled NADPH-d neurons per brain across the LDTg is unchanged among different pharmacological groups (n=6/group; F(2,15)=1.79; p=0.2). Panel C illustrates that the percent (%) of intensely labeled (dark) NADPH-d neurons/section/brain was significantly higher in the chronic morphine group (F(2,15)=11.39, p<0.001; 60.18% ± 12.49) in comparison to both control (21.64% ± 11.25; p<0.01) and acute morphine (34.91% ± 17.97; p<0.05) groups, while the % of lightly labeled NADPH-d neurons/section/brain was significantly lower in chronic morphine group (F(2,15)=11.96, p<0.001; 39.83% ± 12.49) in comparison to both control (78.86% ± 10.53; p<0.01) and acute morphine (65.09% ± 17.97; p<0.05) groups. Panel D shows significant changes in percent intensity of NADPH-d reaction per individual neuron in the adult LDTg between the three treatment groups (F(2,15)=13.45; p<0.001). Specifically, the average intensity of NADPH-d reaction per individual adult neuron of LDTg increased by 44% in the group that received chronic morphine treatment compared to control (p<0.01) and acute morphine (p<0.01) groups. Scale bar = 100 µm. Abbreviations: Aq, cerebral aqueduct; NADPH-d, nicotinamide adenine dinucleotide phosphate diaphorase; *, significant difference.

Similar articles

Cited by

References

    1. Ambasta RK, Kumar P, Griendling KK, Schmidt HH, Busse R, Brandes RP. Direct interaction of the novel Nox proteins with p22phox is required for the formation of a functionally active NADPH oxidase. J Biol Chem. 2004;279:45935–45941. - PubMed
    1. Anand KJ, Willson DF, Berger J, Harrison R, Meert KL, Zimmerman J, Carcillo J, Newth CJ, Prodhan P, Dean JM, Nicholson C. Tolerance and Withdrawal From Prolonged Opioid Use in Critically Ill Children. Pediatrics. 2010;125:1208–1225. - PMC - PubMed
    1. Babey AM, Kolesnikov Y, Cheng J, Inturrisi CE, Trifilletti RR, Pasternak GW. Nitric oxide and opioid tolerance. Neuropharmacology. 1994;33:1463–1470. - PubMed
    1. Banfi B, Clark RA, Steger K, Krause KH. Two novel proteins activate superoxide generation by the NADPH oxidase NOX1. J Biol Chem. 2003;278:3510–3513. - PubMed
    1. Barbaresi P. Postnatal development of GABA-immunoreactive neurons and terminals in rat periaqueductal gray matter: a light and electron microscopic study. J Comp Neurol. 2010;518:2240–2260. - PubMed

Publication types

MeSH terms