Review
. 2012 Oct;22(5):679-88.
doi: 10.1016/j.sbi.2012.09.002. Epub 2012 Sep 20.

Red fluorescent proteins: chromophore formation and cellular applications

Affiliations
Review

Red fluorescent proteins: chromophore formation and cellular applications

Atsushi Miyawaki et al. Curr Opin Struct Biol. 2012 Oct.

Abstract

In the last decade, a number of red fluorescent proteins (RFPs) that emit orange, red, and far-red fluorescence have been isolated from anthozoans (corals), and developed through directed molecular evolution. An attractive property possessed by some RFPs is that their red fluorescence can be turned on or modulated by illumination at specific wavelengths. Recent progress in the development of RFPs has been accompanied with detailed studies of chromophore chemistry. A thorough understanding of the molecular mechanisms involved in the post-translational modifications of red chromophores would enable scientists to design RFPs with the desired properties to advance imaging applications. This article provides a broad perspective on the chemistry and applications of RFPs.


Figures

Figure 1
Figure 1
Chemical transformations of the chromophores in RFPs. The DsRed and Kaede families are shown with pink and green backgrounds, respectively. π-conjugation for visible-light absorption that results in a substantial amount of fluorescence is indicated by colored shading; gray shading denotes nonfluorescence. Solid arrows indicate autocatalytic or photo-induced modifications. Anti-parallel solid arrows indicate cis–trans isomerizations or equilibriums between ionized (a) and protonated (b) states. Dotted arrows indicate chromophore transformations resulted from mutagenesis of the amino acid residues surrounding the chromophore. Consequently, for example, chromophores 6b and 15 may have different degrees of electron conjugation despite the same chemical structures. This applies to chromophores 7b and 16, chromophores 12a and 13, and chromophores 12b and 17. The green-emitting chromophore of Aequorea GFP, 4-(p-hydroxybenzylidene)-5-imidazolinone, is shown as chromophore 4. The internal tripeptide, Ser65–Tyr66–Gly67, forms the chromophore by nucleophilic attack of Gly67-Nα on the carbonyl group of Ser65, followed by dehydration and oxidation of the Cα–Cβ bond of Tyr66 (1234). From a more detailed perspective, however, Aequorea GFP maturation is best described by a cyclization–oxidation–dehydration sequence. By contrast, maturation of red-emitting chromophores involves a formation of N-acylimine by desaturation of Cα65–N65 bond at the first stage before the formation of double bond between Cα and Cβ of Tyr66 (12356a). The chemical structures with colored clouds (15, 16, and 17) denote the protonated chromophores that transform to emitting anionic forms via the ESPT pathway. hv, photon.
Figure 2
Figure 2
Single excitation wavelength dual FRET sensor imaging in transfected HeLa cells, (a, b) HeLa cell coproducing the calcium sensor YC3.6 [59] and the LSSmOrange-mKate2 caspase-3 biosensor, 10 min after addition of histamine (h) to the medium (a) and 4 hours after starting the experiment (b). The cells were stimulated with staurosporine (s) after 30 min. The left panels show the total fluorescence intensity. The middle panels represent the fraction of Ca2+-bound YC3.6 sensor to the total amount of YC3.6 sensor, and the right panels display the fraction of active, cleaved capase-3 sensor to the total amount of caspase-3 sensor. To reduce background contributions, the fraction images have been multiplied with a binary mask of the intensity image. Scale bar, 3 µm. (c) Temporal evolution of the sensor-activities in a region within the cell, indicated by the white box. The curves represent the fraction of Ca2+-bound YC3.6 sensor (blue) and the fraction of cleaved capase-3 biosensor (orange). Courtesy of M.A. Hink and Th.W.J. Gadella, University of Amsterdam, Netherlands.
Figure 3
Figure 3
Differential photoswitching of PSCFP2 and PSmOrange co-expressed in a live mammalian cell [40]. The nucleus-localized NLS-PSCFP2 was photoswitched from a cyan form to a green form with 390/40 nm light. The vimentin-PSmOrange fusion protein was photoswitched from an orange form to a far-red form with 540/20 nm light. Photoswitching time for each was 14 s. Scale bar, 10 µm.
Figure 4
Figure 4
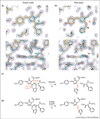
Structural basis for the green-to-red conversion, (a) Electron density maps (2Fo-Fc at 1.5σ) showing the chromophore structure of the green-emitting (unconverted) state viewed from the top (top panel) and side (bottom panel) of the chromophore plane, (b) The structure of the red (converted) state viewed from the top (top panel) and side (bottom panel) of the chromophore plane. Electron density connecting His62-Cα and His62-Nα exists in (a) (green arrows), but not in (b) (red arrows). The red arrowhead indicates the cis configuration of the C═C double bond in the (5-imidazolyl)ethenyl group of the red-emitting chromophore. (c, d) Summary of β-elimination and extension of the π-conjugated system in KikGRX (c) or Kaede and EosFP (d). The structures derived from Phe61, His62, Tyr63, and Gly64 are drawn; the neighboring amino acids (single-letter code) are also shown. C═C double bonds in the (5-imidazolyl)ethenyl group and the neighboring bonds are colored in red in chromophores of the red states.
Figure 5
Figure 5

References

    1. Tsien RY. The green fluorescent protein. Annu Rev Biochem. 1998;67:509–544. - PubMed
    1. Mishin AS, Subach FV, Yampolsky IV, King W, Lukyanov KA, Verkhusha VV. The first mutant of the Aequorea victoria green fluorescent protein that forms a red chromophore. Biochemistry. 2008;47:4666–4673. - PMC - PubMed
    1. Matz MV, Fradkov AF, Labas YA, Savitsky AP, Zaraisky AG, Markelov ML, Lukyanov SA. Fluorescent proteins from nonbioliminescent Anthozoa species. Nat Biotechnol. 1999;17:969–972.A key paper demonstrating that anthozoan animals express spontaneously fluorescent proteins.

    1. Day RN, Davidson MW. The fluorescent protein palette: tools for cellular imaging. Chem Soc Rev. 2009;38:2887–2921. - PMC - PubMed
    1. Chudakov DM, Matz MV, Lukyanov S, Lukyanov KA. Fluorescent proteins and their applications in imaging living cells and tissues. Physiol Rev. 2010;90:1103–1163. - PubMed

Publication types

Substances

LinkOut - more resources