. 2012 Nov 6;22(21):2042-7.
doi: 10.1016/j.cub.2012.08.016. Epub 2012 Sep 20.

Deep brain photoreceptors control light-seeking behavior in zebrafish larvae

Affiliations

Deep brain photoreceptors control light-seeking behavior in zebrafish larvae

António M Fernandes et al. Curr Biol. .

Abstract

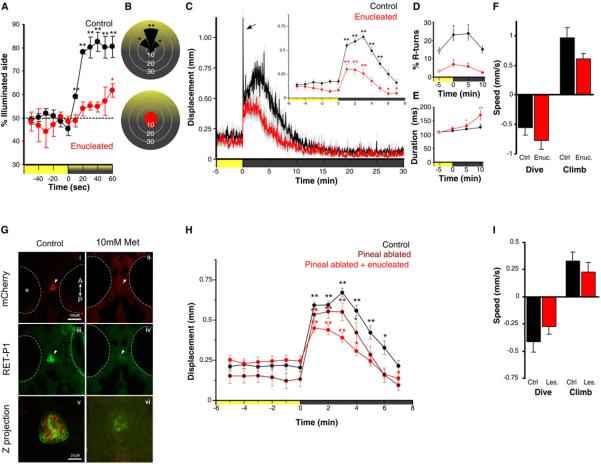
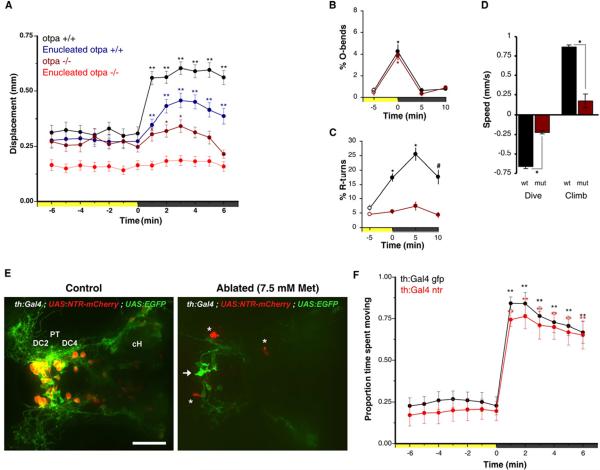
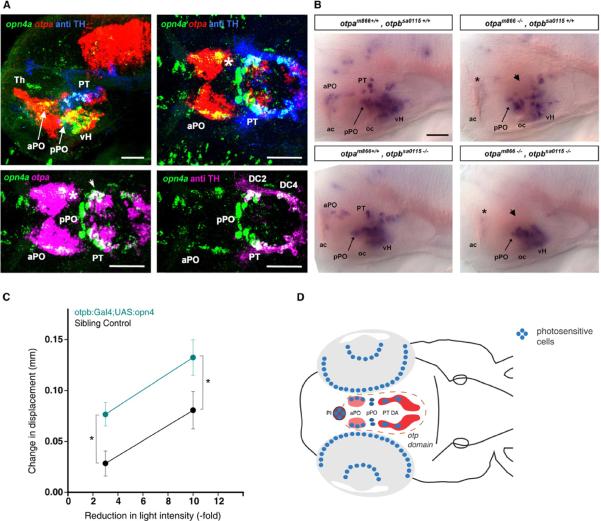
Most vertebrates process visual information using elaborately structured photosensory tissues, including the eyes and pineal. However, there is strong evidence that other tissues can detect and respond to photic stimuli. Many reports suggest that photosensitive elements exist within the brain itself and influence physiology and behavior; however, a long-standing puzzle has been the identity of the neurons and photoreceptor molecules involved. We tested whether light cues influence behavior in zebrafish larvae through deep brain photosensors. We found that larvae lacking eyes and pineal perform a simple light-seeking behavior triggered by loss of illumination ("dark photokinesis"). Neuroanatomical considerations prompted us to test orthopedia (otpa)-deficient fish, which show a profound reduction in dark photokinesis. Using targeted genetic ablations, we narrowed the photosensitive region to neurons in the preoptic area. Neurons in this region express several photoreceptive molecules, but expression of the melanopsin opn4a is selectively lost in otpa mutants, suggesting that opn4a mediates dark photokinesis. Our findings shed light on the identity and function of deep brain photoreceptors and suggest that otpa specifies an ancient population of sensory neurons that mediate behavioral responses to light.


Figures

Figure 1
Figure 1. Light-driven behavior in larval zebrafish without eyes or pineal
(A) Attraction of control and enucleated larvae to a phototaxis stimulus, measured by the percent of larvae observed on the illuminated side of the testing arena over time. Enucleated larvae exhibit a gradual shift to the illuminated side of the arena (symbols show one sample t-test to 50%; N=4 groups of 15 larvae). Larval positions were recorded every second and then averaged over 10 s for each time point. Color along X-axis indicates light condition. (B) Larval body orientation during exposure to a phototaxis stimulus. A significant proportion of control larvae exhibit a `head-on' orientation towards the spotlight (one way ANOVA; F7, 24=51.21, p<0.001; comparisons are Tukey post-hoc), whereas enucleated larvae show no bias in body orientation (ANOVA; F7, 24=1.73, p=0.15; N=4 groups of 15 fish). Data represents mean proportion of larvae oriented relative to the target light over 1 min. (C) Locomotor activity during dark-induced VMR. Arrow indicates O-bend spike only observed in controls. Inset: enucleated larvae significantly increase activity following light extinction (repeated measures ANOVA; F2.5, 88.7=16.57, p<0.001) (N=36 larvae). Data represents the mean activity for the preceding minute. Color along X-axis indicates light condition. Pairwise comparisons are to the baseline time point at -5 min. (D and E) Kinematic analysis of VMR. Enucleated larvae (red) retain elevated (D) R-turn initiation frequency (repeated measures ANOVA; F2.1, 56.6=4.63, p=0.013) and (E) swim bout duration (repeated measures ANOVA; F3, 40=6.41, p=0.001) as seen in controls. Data represents the mean of observations during the first 16 s following each time point. Pairwise comparisons are to the baseline measurement at -5 min (empty circles)(control: N=18 groups of 10 larvae; enucleated: N=28 groups of 10 larvae). (F) Diving and climbing speed during VMR. In either response, enucleated larvae were not significantly different from controls (dive: t-test, p=0.27; climb: t-test, p=0.07) (N=6 groups of 5 larvae). Additionally, speed in all conditions is significantly different from 0 (one sample t-test, p<0.005). Data represents mean vertical swim speed over the first 20s of dive and ascent. (G) Nitroreductase mediated ablation of the pineal. Epifluorescent image of dorsal view of pineal (arrow) in untreated and metronidazole (Met) treated Tg(tph2:NfsB-mCherry)y227 larvae with (i-ii) anti-mCherry (red) and (iii-iv) anti-RET-P1 (green) (6 dpf). Scale bar is 100 μm. (v) Confocal z projection (mCherry + RET-P1) showing concurrent nitroreductase and opsin expression in the pineal. Scale bar is 25 μm. (H) VMR in enucleated, pineal-ablated larvae. Both pineal ablated and pineal ablated-enucleated larvae show a robust VMR following light extinction (repeated measures ANOVA; F3.8, 131.3 =32.44, p<0.001) (control and double lesioned: N=36 larvae; pineal ablated: N=26 larvae). Data represents mean activity for the preceding minute. Pairwise comparisons are to baseline time point -5 min. (I) Diving and climbing speed of enucleated, pineal-ablated larvae during VMR. In either response, lesioned fish were not significantly different from controls (t-test: dive: p=0.26; climb: p=0.42). Mean speed of dive and ascent for both groups is significantly different from zero (one sample t-test, p<0.005) (N=14 groups of 5 larvae). Data represents mean swim speed over the first 20 s of dive and ascent. For all panels, error bars show SEM and * p<0.05, ** p<0.01.
Figure 2
Figure 2. Reduction of VMR in otpa mutants and lack of dopaminergic contribution
(A) Locomotor activity during dark-induced VMR of intact and enucleated otpa mutants and sibling larvae. Intact mutants show a response to light extinction (repeated measures ANOVA; F3.0,175=8.5, p<0.01; N=59 larvae) that is greatly reduced relative to controls (intact siblings: N=47 larvae; enucleated siblings: N=97 larvae). Without eyes, mutants lose any response to light extinction (repeated measures ANOVA; F3.2,317 =1.72, p=0.16; N=101 larvae). Data represents mean activity for the preceding minute. Color along X-axis indicates light condition. Pairwise comparisons to baseline time point 0 min: *p<0.05, **p<0.01. (B and C) Kinematic analysis of photokinesis in intact otpa mutants. Otpa mutants retain O-bend responses to light extinction (B) (repeated measures ANOVA ; F3,9=53.7 ; p<0.001 ; N=4 groups of 10 larvae) but do not show characteristic increases in R-turn initiation (C ; F3,9=2.1; p=0.17 ; N=4 groups of 10 larvae). # p<0.05, * p<0.01 for pairwise comparisons to baseline at -5 min (empty circles). Data represents the mean and SEM of observations during the first 16 s following each time point. (D) Diving and climbing speed of intact otpa mutant larvae. Compared to siblings, otpa mutants exhibit significantly reduced diving speed during and climbing speed following a 60 s dark flash (t-test: dive: p<0.001; climb: p<0.005 ; N=3 groups of 8 larvae). Data represents mean and SEM swim speed over first 20 s of dive and ascent. (E) Nitroreductase mediated ablation of dopaminergic (DA) neurons in Tg(BACth:Gal4VP16) m1233; Tg(UAS:EGFPCAAX); Tg(UAS-E1b:NfsB-mCherry) triple transgenic larvae. The asterisk indicates mCherry aggregates remaining from ablated cells. The arrow indicates GFP expressing non-ablated cells. PT-posterior tuberculum; DC2, DC4 - Otp-dependent dopaminergic groups 2 and 4; cH - caudal hypothalamus. Dorsal view. Scale bar is 50 μm. (F) VMR in DA neuron ablated larvae. Control Tg(th:Gal4VP16); Tg(UAS:EGFPCAAX) (black line) and DA neuron ablated larvae Tg(th:Gal4VP16); Tg(UAS-E1b:NfsB-mCherry) (red line) show similar, robust VMR following light extinction (repeated measures ANOVA; F12, 564 =148.29, p<0.001) (N=48 larvae). Data represents mean and SEM activity as in A. Pairwise comparisons to baseline time point at -5 min *p<0.05, **p<0.01.
Figure 3
Figure 3. opn4a expression depends on Otp activity in areas of co-expression with otpa
(A) Analysis of expression domains of opn4a, otpa, and TH (anti-TH) in 3 dpf wild type larvae. Top row shows z-projections of combined channels (see labels) of confocal stacks recorded from lateral (left) and dorsal (right) views of the brain. Anterior at left, dorsal at top for lateral view. Bottom row shows z-projections of channel combinations of a confocal stack showing dorsal views of the brain. Scale bars are 50 μm. opn4a is co-expressed with otpa in the anterior preoptic area (aPO) (asterisk) and posterior tuberculum (PT)(arrowhead). (B) Expression of opn4a in otpa and otpb mutants. Whole-mount in situ hybridization reveals loss of opn4a expression in the aPO (arrow) and PT (arrowhead) of otpa and otpa, otpb double mutants (3 dpf). otpb mutants alone did not significantly affect opn4a expression, which is in line with the previously reported compensation of otpb knockdown by otpa activity in A11 DA neuron differentiation [20]..Anterior at left, dorsal up. Scale bar is 50 μm. (C) Increase in activity following decrements in light intensity in enucleated Tg(otpb.A:Gal4)zc67; Tg(UAS:GFP-v2a-opn4)y233 larvae. Data shows the difference in mean activity between 2 min after light change and 1 min prior to light change (mean displacement at t2 – mean displacement at t-1). Enucleated opn4 overexpressing larvae show an increased response to decrements in light intensity (repeated measures, 2 way ANOVA; F1, 100 =8.84, p<0.005) (non-expressing control: 28 larvae; GFP positive in otpb domain: N=42 larvae). * p<0.001 (D) Schematic summarizing our results suggesting preoptic opn4a expressing neurons are deep brain photoreceptor driving dark photokinesis. We eliminated all depicted photoreceptive regions except the PO and found the VMR response remained intact. As otpa mutants lack aPO but not pPO opn4a expression, and as mutants without eyes do not show a VMR, the behavior must originate in the opn4a positive cells in the aPO (pinkfill). The illustrated DA domain (dark red color fill) only comprises the diencephalic groups 2–6 in the posterior tuberculum (PT DA).

Comment in

References

    1. Frisch K.v. Beitrage zur Physiologie der Pigmentzellen in der Fischhaut. Pflugers Archiv European Journal of Physiology. 1911;138:319–387.
    1. Adler K. Extraocular photoreception in amphibians. Photophysiology. 1976;23:275–298. - PubMed
    1. Yokoyama K, Oksche A, Darden TR, Farner DS. The sites of encephalic photoreception in photoperiodic induction of the growth of the testes in the white-crowned sparrow, Zonotrichia leucophrys gambelii. Cell and tissue research. 1978;189:441–467. - PubMed
    1. Groos G. The comparative physiology of extraocular photoreception. Experientia. 1982;38:989–991. - PubMed
    1. Silver R, Witkovsky P, Horvath P, Alones V, Barnstable CJ, Lehman MN. Coexpression of opsin- and VIP-like-immunoreactivity in CSF-contacting neurons of the avian brain. Cell and tissue research. 1988;253:189–198. - PubMed

Publication types

Substances