. 2012 Nov 9;48(3):409-21.
doi: 10.1016/j.molcel.2012.08.018. Epub 2012 Sep 20.

Extensive degradation of RNA precursors by the exosome in wild-type cells

Affiliations

Extensive degradation of RNA precursors by the exosome in wild-type cells

Rajani Kanth Gudipati et al. Mol Cell. .

Abstract

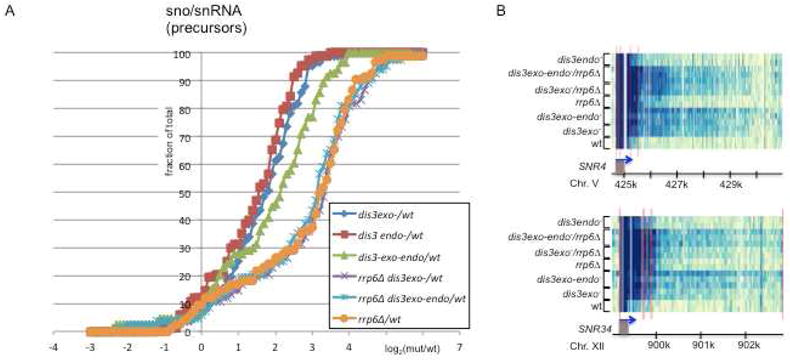
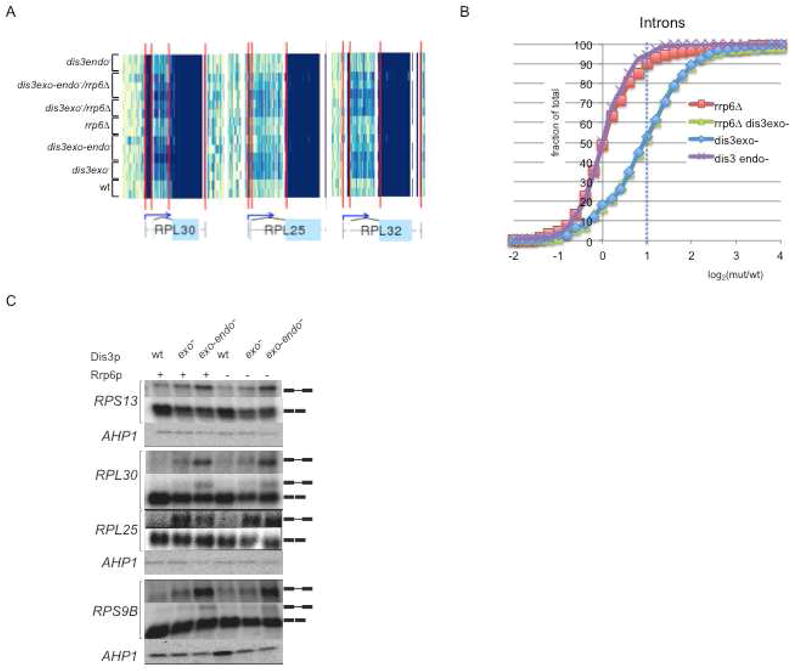
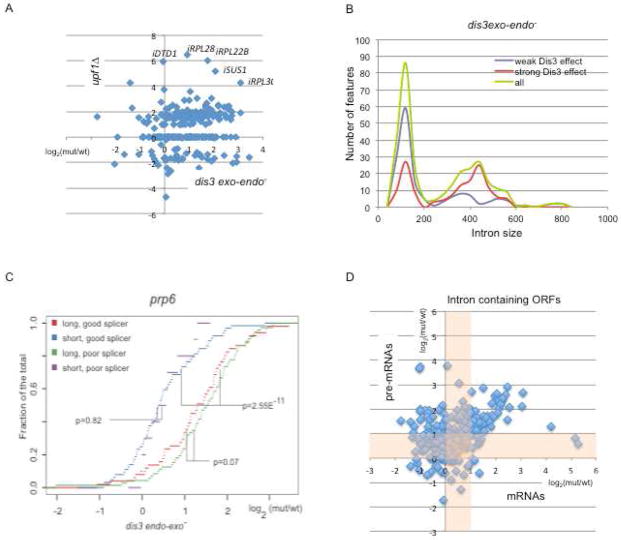
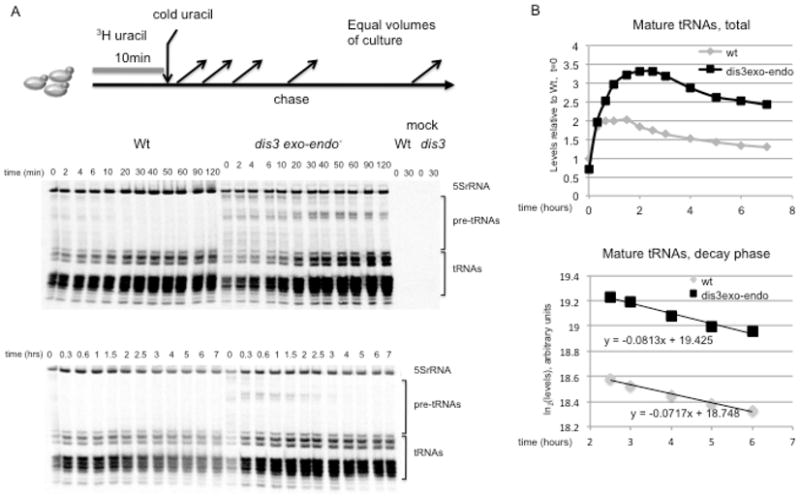
The exosome is a complex involved in the maturation of rRNA and sn-snoRNA, in the degradation of short-lived noncoding RNAs, and in the quality control of RNAs produced in mutants. It contains two catalytic subunits, Rrp6p and Dis3p, whose specific functions are not fully understood. We analyzed the transcriptome of combinations of Rrp6p and Dis3p catalytic mutants by high-resolution tiling arrays. We show that Dis3p and Rrp6p have both overlapping and specific roles in degrading distinct classes of substrates. We found that transcripts derived from more than half of intron-containing genes are degraded before splicing. Surprisingly, we also show that the exosome degrades large amounts of tRNA precursors despite the absence of processing defects. These results underscore the notion that large amounts of RNAs produced in wild-type cells are discarded before entering functional pathways and suggest that kinetic competition with degradation proofreads the efficiency and accuracy of processing.


Figures

Figure 1
Figure 1
A. Scatter plot of log2(mutant/wt) values in rrp6Δ and dis3exo− mutants for CUTs. The parameters of linear regression and the Pearson correlation coefficient are indicated. Values correspond to the average of all the signals detected for every feature and for two biological replicates. B. Cumulative distribution of log2 ratios of stabilization values observed for CUTs for the mutants indicated. Values calculated as in A but with three biological replicates for dis3exo-endo and rrp6Δ dis3exo-endo cells. C. Comparison of cumulative distributions of log2 ratios in rrp6Δ dis3exo-endo cells for the different classes of transcripts as indicated. D. Heatmaps for three previously unannotated regions of cryptic transcription on the Watson strand (indicated by arrowheads) revealed in dis3 and dis3, rrp6Δ mutants. The heatmap profiles correspond to two independent experiments for all mutants and the wild type as indicated with the exception of dis3endo-exo cells for which three independent experiments have been performed. A color scale bar is shown below the heatmap. Green boxes indicate average nucleosome positions according to Mavrich et al. (Mavrich et al., 2008).
Figure 2
Figure 2
A. Cumulative distribution of log2 ratios of stabilization values observed for sn/snoRNA precursors, as in fig. 1B. B. Heatmaps showing regions of transcription extending several kilobases downstream of SNRN4 and SNR34s genes, observed more specifically in dis3 mutants. Color scale as in fig. 1D.
Figure 3
Figure 3
A. Heatmaps showing signals from representative intronic regions in dis3 mutants. Note that RPL25 and RPL30 pre-mRNAs are not stabilized in NMD mutants (Sayani et al., 2008). Color scale as in fig. 1D. B. Cumulative distribution of log2 ratios observed at intronic regions for the different mutants, as in figure 1B. C. Northern blot analysis of intron-containing pre-mRNAs in the different mutants. The identity of the different species is indicated on the right of the panels. The AHP1 mRNA was used as a loading control. Note that the RPL25 pre-mRNA is not stabilized in NMD mutants (Sayani et al., 2008)
Figure 4
Figure 4
A. Scatter plot of stabilization values observed for intronic RNAs stabilized in dis3exo-endo or upf1Δ mutants. Note the overall absence of correlation: a wide range of stabilization values (over three log2 levels) is frequently observed in dis3 mutants for features that share similar levels of stabilization (or that are not stabilized) in upf1Δ cells. B. Intron length distributions for features that are strongly (log2 ratio>1, red) or poorly (log2 ratio<1, purple) affected by Dis3p mutation. The length distribution of all yeast introns (green) is shown as a comparison. C. Cumulative distribution of stabilization values in dis3exo-endo for the four possible classes of introns separated by length and sensitivity to prp6-1 mutation. p-values are indicated. D. Scatter plot of the stabilization values observed in dis3exo cells for mRNAs and pre-mRNAs derived from intronic features. The shaded areas indicate the regions of log2ratios <1. 49% of pre-mRNAs derived from intron-containing features are stabilized in this mutant with a log2 ratio>1. Of these, 46% also display increased mRNA levels (log2 ratio>1).
Figure 5
Figure 5
A. Agarose gel electrophresis analysis of abundant RNA species detected by SYBR green in the mutants indicated after depletion of wt Dis3p for 8 hours. Quantification of the gel gives an estimated 2.5 fold accumulation of tRNAs relative to total RNA in the dis3exo-endo mutant cells. B. Cumulative distribution of log2(mutant/wt) stabilization values observed for tRNAs in the different mutants. Values calculated as in figure 1B but with three biological replicates for dis3exo-endo and rrp6Δ dis3exo-endo cells. C. Northern blot analysis of pre-tRNAs and mature tRNAs species as indicated. pre-tRNAs were detected with intronic probes. The nature of the different species is indicated on the right. Replicate blots (separated by black bars) were hybridized sequentially to probes directed against the species indicated. A 5S rRNA loading control is shown for every blot. Individual signals are quantified relative to 5S rRNA and expressed relative to the signal in the wild type strain. D. Relaxation-like experiment to detect tRNA levels as a function of Dis3p activity. Wild type Dis3p was depleted by doxycycline treatment in cells also expressing the dis3-exo-endo allele (or wt DIS3 as a control) as indicated. Wild type Dis3p re-expression was allowed by doxycyclin withdrawal after 8 hours and tRNA levels were monitored relative to total RNA during the whole experiment. As a control we monitored the cryptic unstable transcript NEL025c by quantitative RT-PCR. Due to its extremely short half life, the levels of NEL025c follow closely wild type Dis3p activity. The levels of the RNA derived from the Tet-DIS3 locus were also monitored by quantitative RT-PCR. The abundance of the different species relative to the starting levels (tRNAs and endogenous DIS3 mRNA) or to the maximum level (NEL025C) is plotted as indicated.
Figure 6
Figure 6
A. Pulse-chase experiments to monitor newly synthesized tRNA species and tRNA decay rates. Endogenous wt Dis3p was depleted for 6 hours in the presence of ectopically expressed mutant (exo-endo) or wild type Dis3 as a control. Newly transcribed RNAs were labeled for 10min with tritiated uracil and analyzed by denaturing PAGE after addition of excess cold uracil at the time points indicated. Equal volumes of cells were used for RNA extraction. Top panel: early time points of the chase to visualize the increase in pre-tRNAs (indicated on the right). In the last four lanes (mock) cold uracil was added at the same time as tritiated uracil as a control. Bottom panel: late time points from an independent experiment to measure the decay rates of mature tRNAs levels during the chase. B. Quantification of mature tRNA levels from the late time points of the chase (A, bottom panel). In the lower graph, late time point values values from the same quantification are represented on a semilog scale to provide linear regression plots. Note that the slopes are very similar for the wt and the dis3 mutant. From this graph a global half life of less than 8.5 (dis3 mutant) and 9 (wt) hours can be estimated.
Figure 7
Figure 7
Model proposed for the degradation of tRNA precursors in wild type cells. tRNAs precursors might be committed to degradation early after transcription, possibly due to the interaction of the exosome with Pol III subunits and/or the recognition of pre-tRNAs by the Nrd1 complex. Degradation by the exosome (red arrows) does not occur if processing (blue arrows) occurs efficiently and/or fast. The exosome might nevertheless degrade a fraction of functional tRNAs and/or eliminate dead-end intermediates that have been mis-processed (green arrow).

References

    1. Alexandrov A, Chernyakov I, Gu W, Hiley SL, Hughes TR, Grayhack EJ, Phizicky EM. Rapid tRNA decay can result from lack of nonessential modifications. Mol Cell. 2006;21:87–96. - PubMed
    1. Allmang C, Kufel J, Chanfreau G, Mitchell P, Petfalski E, Tollervey D. Functions of the exosome in rRNA, snoRNA and snRNA synthesis. EMBO J. 1999;18:5399–5410. - PMC - PubMed
    1. Andrulis ED, Werner J, Nazarian A, Erdjument-Bromage H, Tempst P, Lis JT. The RNA processing exosome is linked to elongating RNA polymerase II in Drosophila. Nature. 2002;420:837–841. - PubMed
    1. Bonneau F, Basquin J, Ebert J, Lorentzen E, Conti E. The yeast exosome functions as a macromolecular cage to channel RNA substrates for degradation. Cell. 2009;139:547–559. - PubMed
    1. Bousquet-Antonelli C, Presutti C, Tollervey D. Identification of a regulated pathway for nuclear pre-mRNA turnover. Cell. 2000;102:765–775. - PubMed

Publication types

MeSH terms