. 2012 Nov 7;20(11):1881-92.
doi: 10.1016/j.str.2012.08.020. Epub 2012 Sep 20.

Crystal structure of the yeast vacuolar ATPase heterotrimeric EGC(head) peripheral stalk complex

Affiliations

Crystal structure of the yeast vacuolar ATPase heterotrimeric EGC(head) peripheral stalk complex

Rebecca A Oot et al. Structure. .

Abstract

Vacuolar ATPases (V-ATPases) are multisubunit rotary motor proton pumps that function to acidify subcellular organelles in all eukaryotic organisms. V-ATPase is regulated by a unique mechanism that involves reversible dissociation into V₁-ATPase and V₀ proton channel, a process that involves breaking of protein interactions mediated by subunit C, the cytoplasmic domain of subunit "a" and three "peripheral stalks," each made of a heterodimer of E and G subunits. Here, we present crystal structures of a yeast V-ATPase heterotrimeric complex composed of EG heterodimer and the head domain of subunit C (C(head)). The structures show EG heterodimer folded in a noncanonical coiled coil that is stabilized at its N-terminal ends by binding to C(head). The coiled coil is disrupted by a bulge of partially unfolded secondary structure in subunit G and we speculate that this unique feature in the eukaryotic V-ATPase peripheral stalk may play an important role in enzyme structure and regulation by reversible dissociation.


Figures

Figure 1
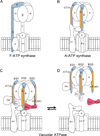
Figure 1. Schematic of the F-, A- and V-type rotary motor ATPase families
The peripheral stalk subunits are colored to highlight differences in stoichiometry and topology. (A) In the bacterial F-type enzyme, a single peripheral stalk is connected to subunit a via membrane spanning N-termini with its C-terminus linked to the catalytic sector via the globular δ subunit (subunit nomenclature of the bacterial enzyme). (B) The A-type enzyme contains two peripheral stalks each composed of a heterodimer of subunits E and H. Here the peripheral stalks are bound to the membrane by an interaction with the soluble N-terminal domain of subunit I (INT), while their C-termini are linked to the catalytic sector by a globular domain in the C-terminus of subunit E. Archaeal subunits H and I are homologs of eukaryotic subunits G and a, respectively. (C) The eukaryotic V-ATPase motor is structurally similar to the A-ATPase but contains three heterodimeric peripheral stalks (EG1-3). As in A-ATPase, two (EG1 & EG2) are linked to aNT via their N-termini, with a third one (EG3) connected to aNT via the C-subunit (shown in red), a subunit only found in the eukaryotic V-ATPase. (D) V-ATPase activity is regulated in response to nutrient availability by a unique mechanism referred to as reversible dissociation. During enzyme dissociation, subunit C is released from the complex, the catalytic sector disengages from the membrane and the activity of both ATPase and ion channel are silenced.
Figure 2
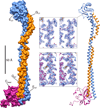
Figure 2. Overall structure of the V-ATPase EGChead subcomplex
Heterotrimeric EGChead complex is characterized by an 150 Å long α helical coiled coil formed by the N-terminal ~100 residues of the E (blue) and G (orange) subunits that is capped on both ends by globular domains. The N-termini of E and G are bound to Chead (violet red) with the C-terminal end of the coiled coil connected to the globular domain of the E subunit (ECT) and the C-terminal α helix of subunit G (GCT). The two middle panels show two regions of electron density, contoured at 1.2 σ. Lower panel, interface of Chead and subunit E N-terminus; upper panel, β strand Ser185 - Lys196 of subunit E. For the second copy of EGChead in the ASU and a stereo view of electron density from the middle region of the EG coiled coil, see Figures S1 and S2, respectively.
Figure 3
Figure 3. Topology of the EG peripheral stalk heterodimer
(A,B, outer panels) The helices of subunits E (blue) and G (orange) are shown as tubes to highlight the complexity of the coiled-coil interface and modularity of subunit G. (A,B, inner panels) Details of the EG α helical coiled coil interface with residues pointing towards the interface underlined. (C) Primary sequences of subunits E and G labeled with the repeating pattern that constitutes the coiled-coil. Residues predicted to be disordered in subunits E and G are highlighted in blue and orange, respectively. (D) Cross section of the EG coiled coil sliced through the subunit G bulge region looking down the coiled coil axis towards the E C-terminus. For clarity, the C-terminal α helix of subunit E is shown in purple. (E) The “bulge” region of subunit G and the corresponding amino acids from subunit E shown in the 2mFo-DFc electron density map contoured at 1.0 σ. See Figure S3A for a view of the skips in the repeating patterns and Figure S3B for the conservation of predicted disorder in subunits E and G.
Figure 4
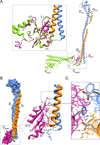
Figure 4. Interaction of EG heterodimer with Chead
(A) Structural alignment of Chead as part of the ternary EGChead complex and the crystal structure of isolated subunit C. The E, G, Chead and full length C subunits are colored in blue, orange, violet red and green, respectively. The full length C subunit (1u7l)was superimposed using Chead as a reference structure. An enlarged view of the region corresponding to the EG-Chead interface is labeled with the secondary structural features of Chead. (B) Left panel: Surface representation of the EGChead structure with hydrophobic residues constituting the interfaces colored in gray. The middle panel shows an enlarged view of the EG-Chead interface with residues involved in the interaction shown as stick representation. (C) Zoom in to highlight the region corresponding to an essential interaction between E (Glu 27), G (Glu14) and Chead (His190).
Figure 5
Figure 5. Comparison of the two conformations of EGChead
The second conformation (opaque) for EGChead is shown overlaid onto the first (transparent). The two conformations were superimposed by (A) aligning the Chead domain (rmsd for aligning E10–54G2–43Chead167–263 = 0.59 Å), (B) the C-terminal domain of the E subunit (rmsd E85-endG75-end = 0.79 Å) and (c) the middle portion of the coiled coil (rmsd E54–84G44–74 = 0.57 Å). See Figure S4 for a more detailed comparison of the two conformations of the eukaryotic and prokaryotic EG heterodimer peripheral stalks.
Figure 6
Figure 6. Fitting of EGChead models into the 3-D EM reconstruction of the eukaryotic V-ATPase
(A) EM density of the insect V-ATPase (Muench et al., 2009), fitted with A3B3DFdc10 (fitting described in Experimental Procedures). The model is oriented so that the density corresponding to EG3 is on the right. (B), (C) Views as in (A) with fit of EGChead optimized for either EG heterodimer (B) or the C subunit (C). When optimizing the fit for EG, subunit C is outside the EM density (see arrowhead in (B)). When optimizing the fit for subunit C, the C-terminal domain of EG is outside the contour (see arrow in (C). For (C), intact C was fitted into the EM density and Chead in the EGChead complex was then overlaid to the head domain in intact C subunit. (D)–(F) Views of the EM model with EG3 (D), EG2 (e), EG1 (F) in the front. While EG3 (D) and EG2 (E) have a similar tilted (though straight) appearance (indicated by the black lines), EG1 (F) starts out with a similar angle but then curves to end up almost parallel to the long axis of the complex to allow interaction with HNT and aNT. A slightly better fit for EG1 was obtained with the second conformation due to the kink near the N-terminal hinge in subunit E (see arrows in (F) and (G)). (G) Outlines of the peripheral stalks highlighting the difference in curvature between EG2 and EG3 vs. EG1. For flexible fitting of EGC into the EM density corresponding to EG3 and the C subunit, see Figure S5. A detailed view of the subunit E subunit H interface highlighting conserved residues is shown in Figure S6.
Figure 7
Figure 7. Spring-loading of peripheral stalk EG3
A schematic representation of the linkage of subunit C within the enzyme. During assembly, subunit C is binding to EG3 via its head domain assisted by the chaperone complex, RAVE. (A) Peripheral stalk EG3 as in Figure 6B. (B) During assembly, bending of peripheral stalk EG3 will be required to form the ternary complex between Cfoot, the N-terminal domain of subunit a and peripheral stalk EG2. During disassembly, weakening of the interactions between for example Cfoot and aNT would release the strain imposed on EG3 and serve to pull subunit C out of the V1-Vo interface.

Comment in

References

    1. Adams PD, Afonine PV, Bunkoczi G, Chen VB, Davis IW, Echols N, Headd JJ, Hung LW, Kapral GJ, Grosse-Kunstleve RW, et al. PHENIX: a comprehensive Python-based system for macromolecular structure solution. Acta Cryst. D Biol. Cryst. 2010;66:213–221. - PMC - PubMed
    1. Alper SL. Familial renal tubular acidosis. J. Nephrol. 2010;23(Suppl 16):S57–S76. - PubMed
    1. Armbrüster A, Hohn C, Hermesdorf A, Schumacher K, Börsch M, Grüber G. Evidence for major structural changes in subunit C of the vacuolar ATPase due to nucleotide binding. FEBS Lett. 2005;579:1961–1967. - PubMed
    1. Arnold K, Bordoli L, Kopp J, Schwede T. The SWISS-MODEL workspace: a web-based environment for protein structure homology modeling. Bioinformatics. 2006;22:195–201. - PubMed
    1. Blair HC, Teitelbaum SL, Ghiselli R, Gluck S. Osteoclastic bone resorption by a polarized vacuolar proton pump. Science. 1989;245:855–857. - PubMed

Publication types

MeSH terms

Substances