. 2012 Nov 7;20(11):1893-904.
doi: 10.1016/j.str.2012.08.021. Epub 2012 Sep 20.

Proton-coupled dynamics in lactose permease

Affiliations

Proton-coupled dynamics in lactose permease

Magnus Andersson et al. Structure. .

Abstract

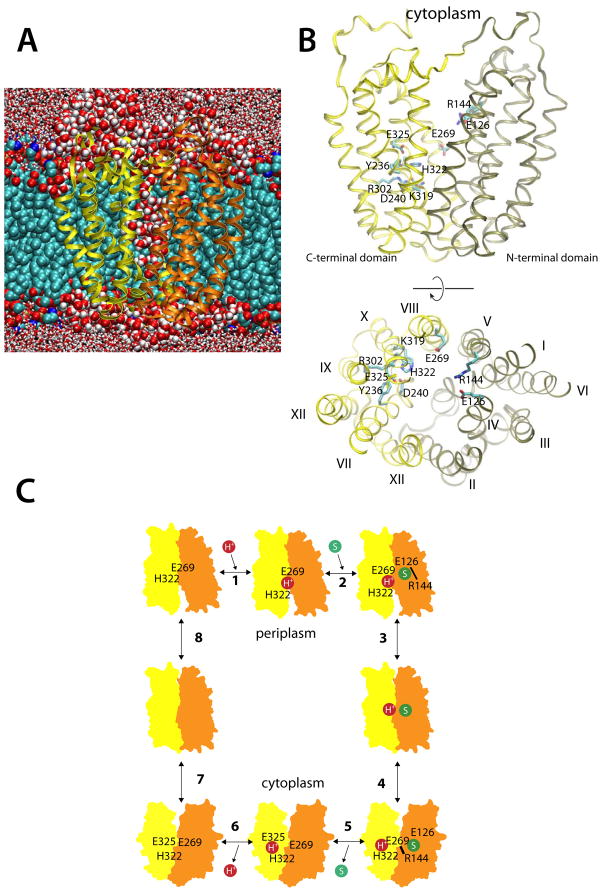
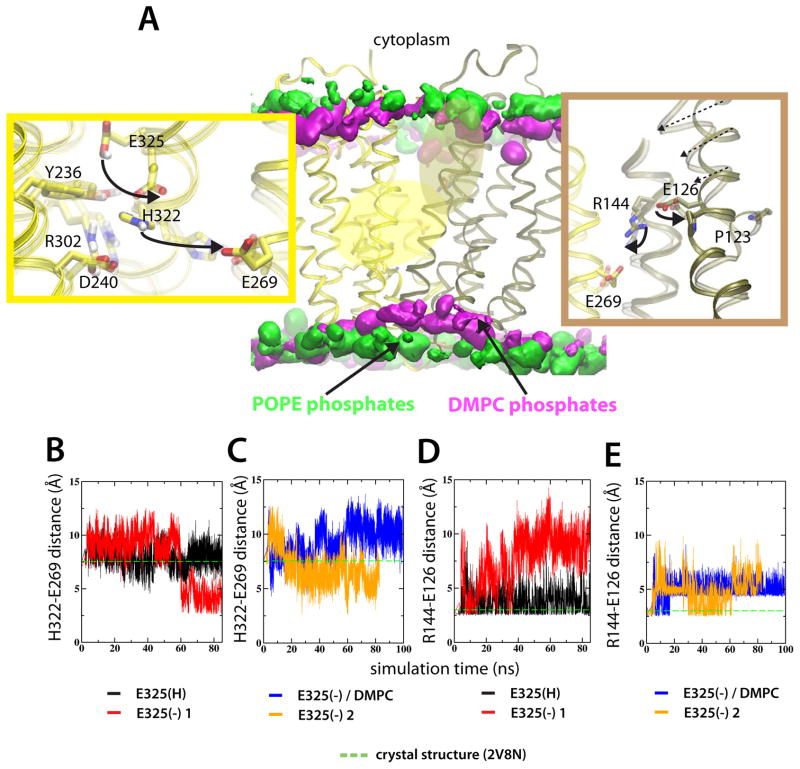
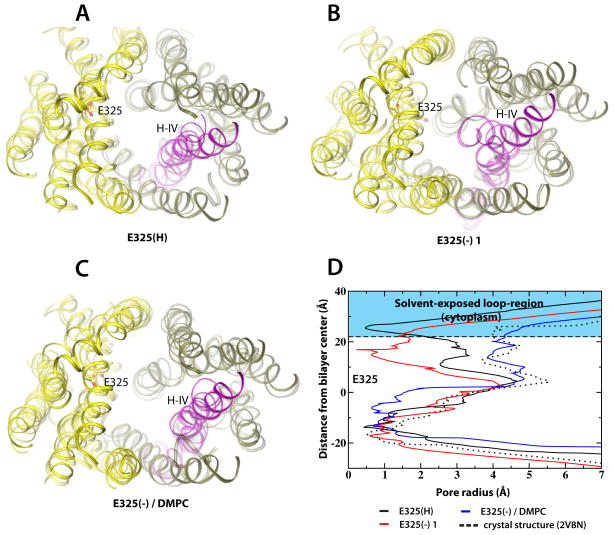
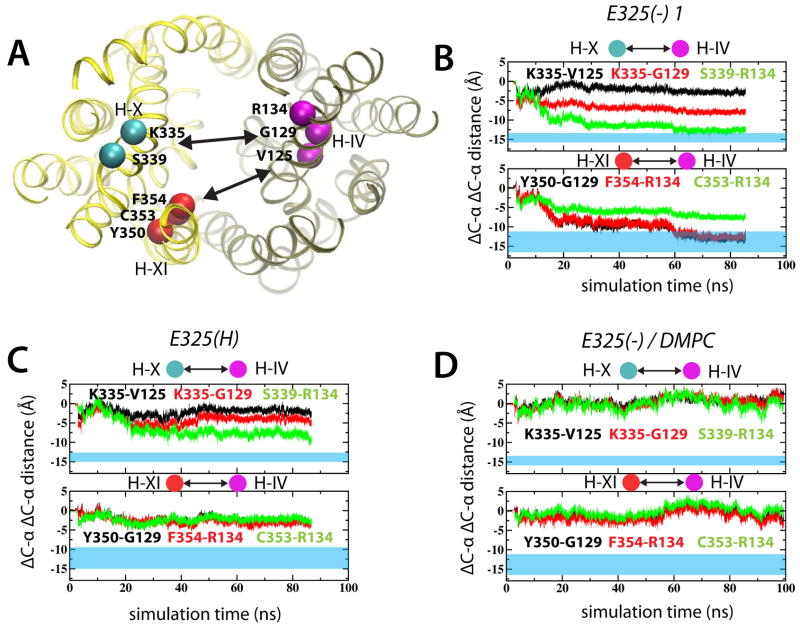
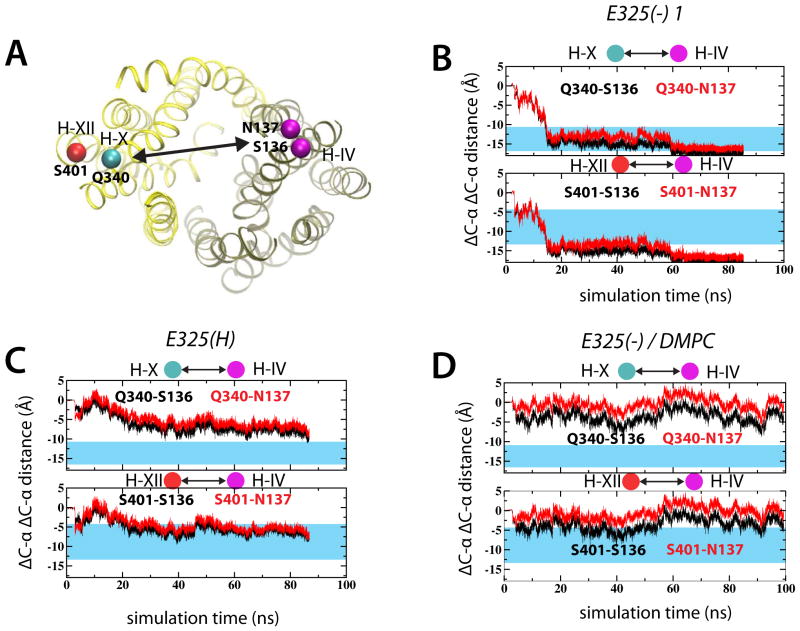
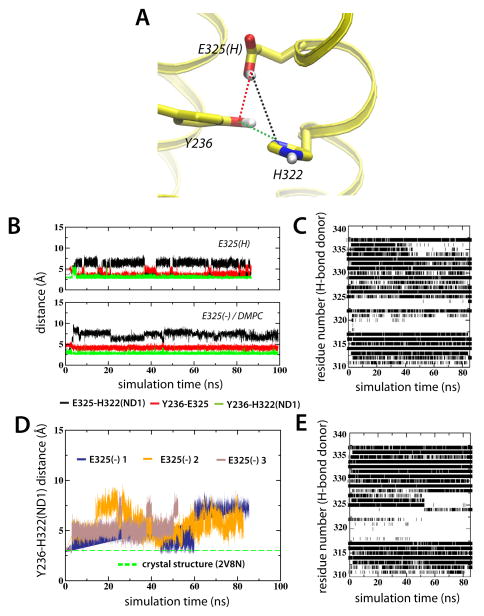
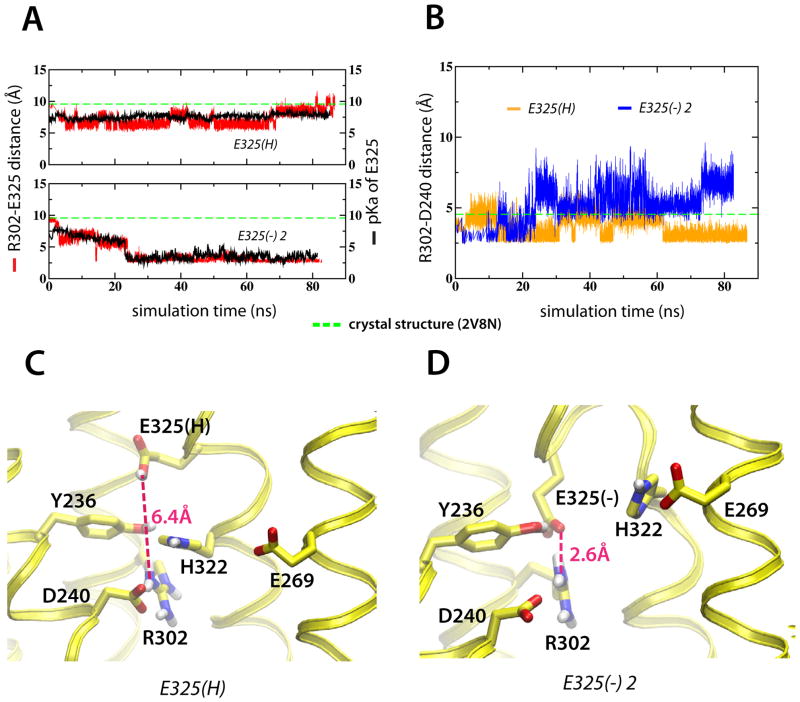
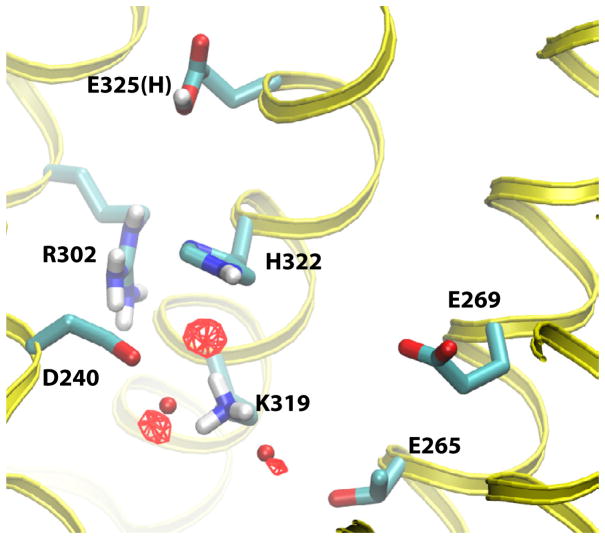
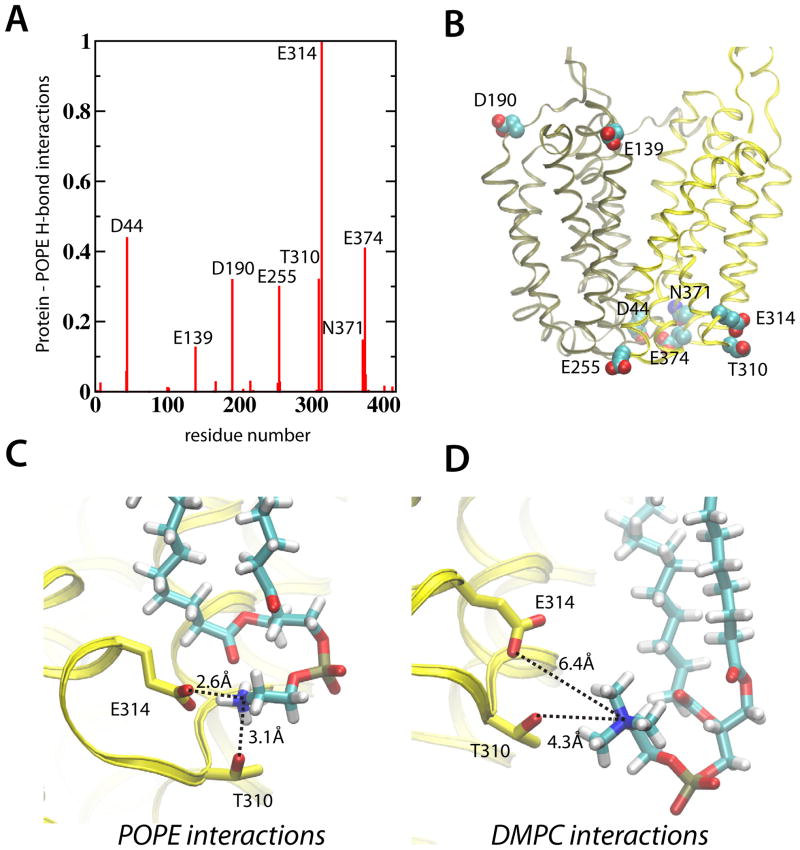
Lactose permease of Escherichia coli (LacY) catalyzes symport of a galactopyranoside and an H⁺ via an alternating access mechanism. The transition from an inward- to an outward-facing conformation of LacY involves sugar-release followed by deprotonation. Because the transition depends intimately upon the dynamics of LacY in a bilayer environment, molecular dynamics (MD) simulations may be the only means of following the accompanying structural changes in atomic detail. Here, we describe MD simulations of wild-type apo LacY in phosphatidylethanolamine (POPE) lipids that features two protonation states of the critical Glu325. While the protonated system displays configurational stability, deprotonation of Glu325 causes significant structural rearrangements that bring into proximity side chains important for H⁺ translocation and sugar binding and closes the internal cavity. Moreover, protonated LacY in phosphatidylcholine (DMPC) lipids shows that the observed dynamics are lipid-dependent. Together, the simulations describe early dynamics of the inward-to-outward transition of LacY that agree well with experimental data.


Figures

Figure 1
Figure 1
Simulating LacY and the sites of H+ translocation and sugar binding. (A) A representative snapshot of the simulation cell. Here, LacY is shown inserted into a POPE bilayer; carbons (cyan), oxygens (red) and phosphates (brown) are represented by van der Waals spheres. The protein N- and C-terminal domains are colored tan and yellow, respectively. Water molecules within 5 Å are depicted as red and white van der Waals spheres, while water beyond this limit are licorice representations. (B) Side-view and top-view of the crystal structure of inward-facing wild-type apo LacY (PDB ID 2V8N), colored according the scheme in (A). Amino acid residues participating in H+ translocation and sugar binding are displayed as cyan licorice representations. (C) The eight-step LacY reaction scheme, where a proton (step 1) and a substrate molecule (step 2) binds to the outward-facing LacY state, which undergoes conformational change to face the cell interior (step 3–4). Substrate release (step 5) and deprotonation (step 6) then trigger the inward-to-outward transition (step 7–8). See also Figure S1.
Figure 2
Figure 2
Structural side-chain rearrangements in LacY are protonation-state dependent. (A) The middle panel shows LacY embedded in two different lipid environments. Lipid phosphates of the POPE and DMPC bilayers are represented by 5% isodensity surfaces in green and silver, respectively. The 5% occupancies correspond to the common surface in 5% of the simulation frames. Two high-dynamic regions are colored according to the closest domain; H+ translocating site and the sugar binding site is yellow and tan, respectively. Details of the H+ translocating site (left panel) and sugar binding site (right panel) show the average of the last ns of the E325(H) and E325(−) 1 simulations in POPE lipids, respectively. The evolution of the inter-atomic H322-E269 distance for the E325(H) and E325(−) 1 simulations (B) and E325(−) in and E325(−) 2 simulations (C), respectively. The corresponding E126-R134 distances are shown in (D-E). Distances in the crystal structure are represented as green, dashed lines. See also Figure S2–S4.
Figure 3
Figure 3
Conformational changes in LacY are protonation-state dependent. Structural changes in LacY are displayed by superimposing the starting structure (solid) on the final snapshot from the (A) E325(H), (B) E325(−) 1 and (C) E325(−)/DMPC simulations (transparent helices). Loop regions were removed for clarity. The N- and C-terminal domains colored in tan and yellow, respectively. Helix IV is depicted in magenta. (D) Pore radius analyses extracted using the program HOLE (Smart et al., 1993) of simulations E325(H) (black) and E325(−) 1 (red) and E325(−)/DMPC (blue). The pore radius of the crystal structure is shown for reference (dotted line). See also Figure S5.
Figure 4
Figure 4
Simulated conformational changes in light of experimental crosslinking data. (A) Specific positions used for crosslinking are marked by spheres in the 2V8N crystal structure. The change in distances between Cα in helices IV-X and IV-XI are shown for the E325(−) 1 (B) and E325(H) (C) simulations. (D) The corresponding distances for the E325(−)/DMPC simulation. The blue transparent regions correspond to experimentally measured distances. See also Figure S8.
Figure 5
Figure 5
Simulated conformational changes in light of experimental DEER data. (A) Specific residues used in the DEER experiments are marked in the 2V8N crystal structure. Changes in Cα-Cα distances between helix IV and either helix X or XII measured from the E325(−) 1 (B) and E325(H) simulations. (D) shows the corresponding distances in the E325(−)/DMPC simulation. See also Figure S9.
Figure 6
Figure 6
Deprotonation of Glu325 affects the solvation shell surrounding His322. (A) Glu325, His322, Tyr236 interactions displayed using the average configuration of the last ns of the E325(H) simulation. (B) The dynamics of Glu325, Tyr236 and His322 are represented as interatomic distances between Glu325-His322 (black), Glu325-Tyr236 (red) and His322-Tyr236 (green). (C) Backbone hydrogen bonding of helix X for the E325(H) simulation. O-HN hydrogen bonds between residue i and i+4 were defined as existing when the O-N distance was within 3.5 Å and the O-H-N angle was greater than 130°. The ev olution of the Y236-H322(ND1) interatomic distance for E325(−) 1, E325(−) 2 and E325 (−) 3 in POPE are shown in (D). (E) corresponds to (C) for the E325(−) 1 simulation.
Figure 7
Figure 7
Structural rearrangements in the H+ translocation site. (A) Inter-atomic distances between Arg302-Glu325 (red) and calculated Glu325 pKa (black) for the E325(H) and E325(−) 1 simulations, respectively. (B) Arg302-Asp240 inter-atomic distances for the E325(H) (orange) and E325(−) 1 (blue) simulations, respectively. (C–D) Structural arrangement in the H+ translocation site visualized by last ns averages from the E325(H) and E325(−) 1 simulations, respectively. See also Figure S6–S7.
Figure 8
Figure 8
Water sites in protonated LacY. Isodensity surfaces (red wireframe) of water molecules depicted at 85% occupancies in the H+ translocating site of protonated LacY (E325(H) simulation). The red licorice spheres correspond to oxygen positions of crystal waters.
Figure 9
Figure 9
Lipid-protein interaction points for the POPE and DMPC lipid bilayers. (A) The relative number of H-bonds between POPE amines (N–H) and protein sidechain donors. A hydrogen bond was considered present for donor-acceptor distances within 3.5 Å and acceptor-H-donor angles greater than 140 degrees. The positions of the eight most lipid-interacting amino acids are shown as van der Waal residues on LacY (B). Detailed interactions between the strongest POPE interacting residues (T310 and E314) in POPE (C) and DMPC (D) lipids.

References

    1. Abramson J, Smirnova I, Kasho V, Verner G, Kaback HR, Iwata S. Structure and mechanism of the lactose permease of Escherichia coli. Science. 2003;301:610–615. - PubMed
    1. Baker J, Wright SH, Tama F. Simulations of substrate transport in the multidrug transporter EmrD. Proteins. 2012;80:1620–1632. - PMC - PubMed
    1. Bogdanov M, Heacock P, Guan Z, Dowhan W. Plasticity of lipid-protein interactions in the function and topogenesis of the membrane protein lactose permease from Escherichia coli. Proc Natl Acad Sci USA. 2010;107:15057–15062. - PMC - PubMed
    1. Bogdanov M, Heacock PN, Dowhan W. A polytopic membrane protein displays a reversible topology dependent on membrane lipid composition. EMBO J. 2002;21:2107–2116. - PMC - PubMed
    1. Bondar AN, del Val C, White SH. Rhomboid protease dynamics and lipid interactions. Structure. 2009;17:395–405. - PMC - PubMed

Publication types