Comprehensive molecular portraits of human breast tumours
- PMID: 23000897
- PMCID: PMC3465532
- DOI: 10.1038/nature11412
Comprehensive molecular portraits of human breast tumours
Abstract
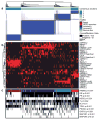
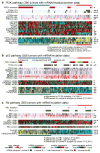
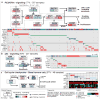
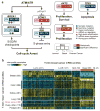
We analysed primary breast cancers by genomic DNA copy number arrays, DNA methylation, exome sequencing, messenger RNA arrays, microRNA sequencing and reverse-phase protein arrays. Our ability to integrate information across platforms provided key insights into previously defined gene expression subtypes and demonstrated the existence of four main breast cancer classes when combining data from five platforms, each of which shows significant molecular heterogeneity. Somatic mutations in only three genes (TP53, PIK3CA and GATA3) occurred at >10% incidence across all breast cancers; however, there were numerous subtype-associated and novel gene mutations including the enrichment of specific mutations in GATA3, PIK3CA and MAP3K1 with the luminal A subtype. We identified two novel protein-expression-defined subgroups, possibly produced by stromal/microenvironmental elements, and integrated analyses identified specific signalling pathways dominant in each molecular subtype including a HER2/phosphorylated HER2/EGFR/phosphorylated EGFR signature within the HER2-enriched expression subtype. Comparison of basal-like breast tumours with high-grade serous ovarian tumours showed many molecular commonalities, indicating a related aetiology and similar therapeutic opportunities. The biological finding of the four main breast cancer subtypes caused by different subsets of genetic and epigenetic abnormalities raises the hypothesis that much of the clinically observable plasticity and heterogeneity occurs within, and not across, these major biological subtypes of breast cancer.
Figures


References
-
- Paik S, et al. A multigene assay to predict recurrence of tamoxifen-treated, node-negative breast cancer. N Engl J Med. 2004;351:2817–2826. - PubMed
-
- van ‘t Veer LJ, et al. Gene expression profiling predicts clinical outcome of breast cancer. Nature. 2002;415:530–536. - PubMed
-
- Slamon DJ, et al. Human breast cancer: correlation of relapse and survival with amplification of the HER-2/neu oncogene. Science. 1987;235:177–182. - PubMed
-
- Bergamaschi A, et al. Distinct patterns of DNA copy number alteration are associated with different clinicopathological features and gene-expression subtypes of breast cancer. Genes Chromosomes Cancer. 2006;45:1033–1040. - PubMed
Publication types
MeSH terms
Substances
Grants and funding
- U24 CA143882/CA/NCI NIH HHS/United States
- P50 CA058223/CA/NCI NIH HHS/United States
- U24 CA143848/CA/NCI NIH HHS/United States
- U24CA143848/CA/NCI NIH HHS/United States
- U54 HG003079/HG/NHGRI NIH HHS/United States
- P30 CA016058/CA/NCI NIH HHS/United States
- U24CA143799/CA/NCI NIH HHS/United States
- U24 CA143883/CA/NCI NIH HHS/United States
- U24 CA143867/CA/NCI NIH HHS/United States
- U24CA143840/CA/NCI NIH HHS/United States
- P50CA58223/CA/NCI NIH HHS/United States
- P30 CA016672/CA/NCI NIH HHS/United States
- K08 CA148912/CA/NCI NIH HHS/United States
- U54 HG003067/HG/NHGRI NIH HHS/United States
- P50CA116201/CA/NCI NIH HHS/United States
- U24 CA143835/CA/NCI NIH HHS/United States
- R01 CA094143/CA/NCI NIH HHS/United States
- U24 CA143866/CA/NCI NIH HHS/United States
- U24CA143858/CA/NCI NIH HHS/United States
- U24CA143882/CA/NCI NIH HHS/United States
- U24CA144025/CA/NCI NIH HHS/United States
- P30 CA016086/CA/NCI NIH HHS/United States
- U01 CA084955/CA/NCI NIH HHS/United States
- U24 CA143845/CA/NCI NIH HHS/United States
- U54 HG004028/HG/NHGRI NIH HHS/United States
- U24 CA143799/CA/NCI NIH HHS/United States
- R01 LM009722/LM/NLM NIH HHS/United States
- U24 CA144025/CA/NCI NIH HHS/United States
- U24CA143883/CA/NCI NIH HHS/United States
- U54HG003079/HG/NHGRI NIH HHS/United States
- U24 CA143840/CA/NCI NIH HHS/United States
- P50 CA116201/CA/NCI NIH HHS/United States
- U24CA143867/CA/NCI NIH HHS/United States
- U24CA143835/CA/NCI NIH HHS/United States
- U24 CA143858/CA/NCI NIH HHS/United States
- U24CA143866/CA/NCI NIH HHS/United States
- U24CA143845/CA/NCI NIH HHS/United States
LinkOut - more resources
Full Text Sources
Other Literature Sources
Medical
Molecular Biology Databases
Research Materials
Miscellaneous

