. 2012 Sep;24(9):3649-68.
doi: 10.1105/tpc.112.098681. Epub 2012 Sep 21.

G protein-coupled receptor-type G proteins are required for light-dependent seedling growth and fertility in Arabidopsis

Affiliations

G protein-coupled receptor-type G proteins are required for light-dependent seedling growth and fertility in Arabidopsis

Felix W Jaffé et al. Plant Cell. 2012 Sep.

Abstract

G protein-coupled receptor-type G proteins (GTGs) are highly conserved membrane proteins in plants, animals, and fungi that have eight to nine predicted transmembrane domains. They have been classified as G protein-coupled receptor-type G proteins that function as abscisic acid (ABA) receptors in Arabidopsis thaliana. We cloned Arabidopsis GTG1 and GTG2 and isolated new T-DNA insertion alleles of GTG1 and GTG2 in both Wassilewskija and Columbia backgrounds. These gtg1 gtg2 double mutants show defects in fertility, hypocotyl and root growth, and responses to light and sugars. Histological studies of shoot tissue reveal cellular distortions that are particularly evident in the epidermal layer. Stable expression of GTG1(pro):GTG1-GFP (for green fluorescent protein) in Arabidopsis and transient expression in tobacco (Nicotiana tabacum) indicate that GTG1 is localized primarily to Golgi bodies and to the endoplasmic reticulum. Microarray analysis comparing gene expression profiles in the wild type and double mutant revealed differences in expression of genes important for cell wall function, hormone response, and amino acid metabolism. The double mutants isolated here respond normally to ABA in seed germination assays, root growth inhibition, and gene expression analysis. These results are inconsistent with their proposed role as ABA receptors but demonstrate that GTGs are fundamentally important for plant growth and development.


Figures

Figure 1.
Figure 1.
GTG/GPHR Is a Conserved Family of Predicted Membrane Proteins Found in Plants, Animals, and Fungi. (A) Sequence alignment of GTG/GPHR proteins from a range of plants and animals. At GTG1 and At GTG2 (Arabidopsis), Mt GTG (Medicago truncatula), Os GTG (Oryza sativa), Pt GTG (Populus trichocarpa), GPCR89 (H. sapiens), Ce GTG1 and Ce GTG2 (Caenorhabditis elegans), Dm GTG (Drosophila melanogaster), GPR89 (Mus musculus), and Xl GTG (Xenopus laevis). The protein sequences show a minimum of 39% sequence identity, with identical amino acids shown in black; asterisks indicate completely conserved amino acids. Membrane domains are indicated by underlining. Dark-gray shading above sequences indicates potentially important domains: a 70–amino acid sequence domain referred to as the DUF3735 family (Pfam), which is found in eukaryotes and has a conserved LSG sequence motif; a region in GTG1 and GTG2 with similarity to the degenerate Ras GTPase-activating protein domain. Light-gray shading indicates a protein kinase ATP binding region signature. (B) Phylogenetic analysis of predicted full-length GTG/GPHR proteins from a range of eukaryotic organisms. A nonrooted, bootstrap consensus tree in circle formation is shown. The sequences and alignment used to generate the tree are available as Supplemental Data Set 1 online. The GenBank accession numbers of the proteins used are shown in Supplemental Table 2 online. (C) Hydropathy plot and topology model of deduced GTG1 amino acid sequence. A 10–amino acid interval size was used for this analysis (positive values are hydrophobic) (http://gcat.davidson.edu/DGPB/kd/kyte-doolittle.htm; Kyte and Doolittle, 1982). Predicted protein structure was generated using the ConPred_v2 transmembrane domain prediction software (available at http://bioinfo.si.hirosaki-u.ac.jp/∼ConPred2).
Figure 2.
Figure 2.
Isolation of T-DNA Insertional Mutants for GTG1 and GTG2. (A) Genotyping mutant lines in Col background by PCR on genomic DNA. Genomic DNA from the wild type (WT), gtg1-2, gtg2-2, and gtg1-2 gtg2-2 were used with primers pairs (1) GTG1 2F plus T-DNA LBa primers, which detect T-DNA in GTG1; (2) GTG1 2F plus GTG1 1R, which are gene-specific primers amplifying GTG1; (3) GTG2 1R plus T-DNA LBa, which detect T-DNA in GTG2; and (4) GTG2 3F and GTG2 1R, which are gene-specific primers amplifying GTG2. (B) Gene expression in mutant lines (Col background) analyzed by RT-PCR. Expression of full-length transcripts for GTG1 (1407 bp) and GTG2 (1404 bp) was determined using primer pairs GTG1 F plus GTG1 Stop R and GTG2 P2 F plus GTG2 Stop R, respectively. Control gene YLS8 was amplified using primers YLS8 1F and YLS8 2R (607-bp product for cDNA). Products using GTG2-specific primers were generated with wild-type (center panel, lane 1) and gtg1-2 mutant (center panel, lane 2) DNA. GTG1-specific primers products were generated with wild-type (top panel, lane 1) and gtg2-2 mutant plants (top panel, lane 3) DNA. Two very faint products, indicated by the arrows, were observed using the GTG1 primers in gtg1-2 (top panel, lane 2) and gtg1-2 gtg2-2 plants (top panel, lane 4). (C) GTG1 and GTG2 genomic organization with T-DNA insertion positions. Dark-gray triangles, position of T-DNA insertion in gtg1-2 and gtg2-2 (Col); light-gray triangles, position of T-DNA insertion in gtg1-3 and gtg2-3 (Ws). Primers used in the genotyping are indicated. Black boxes indicate exons 1 to 13; gray line indicates introns. All primers are listed in Supplemental Table 4 online.
Figure 3.
Figure 3.
gtg1 gtg2 Mutants Exhibit Cellular Distortion. Wild type (Wt) and double mutant seedlings grown in the light for 6 d. (A) Images of wild-type and double mutant shoots grown on 0.5× MS showing distortion in hypocotyl and cotyledons. (B) Light microscopy of hypocotyls of seedlings grown on 0.5× MS showing distended epidermal cells in the double mutants as indicated by black arrows. Bars = 200 μm. (C) Light microscopy of hypocotyls of seedlings grown on 0.5× MS plus 1% Suc showing increased distortion of cells in double mutants. Bars = 200 μm. (D) Transverse sections through hypocotyls and cotyledons of 6-d-old seedlings grown on 0.5× MS plus or minus 1% Suc. Bar = 200 μm.
Figure 4.
Figure 4.
gtg1 gtg2 Mutants Exhibit a Shorter Hypocotyl in the Light. Seedlings were grown in the absence (A) and presence (B) of 1% Suc under D and low WL conditions (10 μmol m−2 s−1). Data represent mean ± se (n = three independent biological repeats, each containing five replicate plates with 25 seedlings per plate). *P ≤ 0.05, Student’s t test. WT, wild type.
Figure 5.
Figure 5.
Response of gtg1 gtg2 Mutants to Suc. (A) Root growth of gtg1 gtg2 mutants is inhibited in the absence of Suc. Representative plates are shown for the wild type (WT) and gtg1 gtg2 mutants on 0.5× MS containing 0 or 1% Suc. (B) and (C) Response of mutants to growth on Suc and mannitol. Seedling ([B], top), shoot ([B], middle), and root ([B], bottom) fresh weight and root length (C) are shown for seedlings grown on Suc or mannitol. (D) Time course for root extension with and without 1% Suc. (E) Concentration curve for root extension of the wild type and gtg1 gtg2 mutants with Suc or mannitol. Data are from representative experiments and represent the mean weights or root lengths ± se determined from six replicate plates per treatment each containing six seedlings per genotype. *P ≤ 0.05, Student’s t test.
Figure 6.
Figure 6.
GTG1 or GTG2 Expression Rescues the gtg1-3 gtg 2-3 Mutant. (A) RT-PCR showing expression of GTG1 and GTG2. Expression of GTG1 (1407 bp) and GTG2 (1404 bp) was determined using primer pairs GTG1 F plus GTG1 Stop R and GTG2 P2 F plus GTG2 Stop R, respectively, in the wild type (WT), gtg double mutants, and three independent 35Spro:GTG expressing lines (a to c). The control gene YLS8 was amplified using primers YLS8 1F and YLS8 2R (607-bp product). (B) Hypocotyl length is restored in gtg double mutants expressing either GTG1 or GTG2. Hypocotyl length was determined after 6 d of growth on 0.5× MS in low light (10 μmol m−2 s−1) or in darkness. Data represent mean of three experiments ± se each containing four plates with 25 seedlings per genotype. (C) Root length is restored in gtg double mutants expressing either GTG1 or GTG2. Root length was determined after 10 d for seedlings grown on 0.5× MS. Data represent mean of three experiments ± se, each containing five plates, each with six seedlings per genotype. For (B) and (C), * = significantly different from the wild type, # = significantly different from gtg1-3 gtg2-3; P ≤ 0.05, Student’s t test.
Figure 7.
Figure 7.
gtg1 gtg2 Double Mutants Are ABA Responsive. (A) Root growth is inhibited by ABA in the wild type (WT) and gtg double mutants. Data shown represent the mean ± se of three experiments, each with four plates per treatment containing six seedlings per genotype. *Significantly different from value at 0 μM ABA, P ≤ 0.05 Student’s t test. (B) Germination is inhibited by ABA in the wild type and gtg double mutants. For each ABA concentration, the percentage of germination is presented. Data represent mean ± se of three experiments, each with three plates containing 25 seeds per genotype. (C) ABA-responsive genes are induced in the wild type and gtg double mutants. Induction of RAB18 and DREB2A expression by 50 μM ABA in the wild type and gtg double mutants using real-time PCR with Actin2 used for normalization. All data are means of four independent biological replicates ± se.
Figure 8.
Figure 8.
gtg1 gtg2 Pollen Have a Reduced Germination Rate and Pollen Tube Growth. (A) In vitro pollen tube growth for the wild type (WT) and gtg double mutants. Representative images are taken for the wild type and gtg double mutants after 2 h. Bars = 200 μm. (B) Pollen germination. Data are from a representative experiment of pollen grown in vitro and show the mean ± se from three plants measuring ∼200 pollen from each.*Significantly different from the wild type; P ≤ 0.05, Student’s t test. (C) Pollen tube length in the wild type and double mutants. Data are from a representative experiment of pollen grown in vitro for 16 h and show the mean ± se of 40 to 60 pollen tubes for germinated pollen.*P ≤ 0.05, Student’s t test. (D) In vivo pollen growth assay for the wild type and gtg double mutants. Arrows indicate end of extension of pollen tubes, and bar = 200 μm.
Figure 9.
Figure 9.
Silique and Seed Phenotypes in gtg Mutants. (A) The gtg double mutants have shorter siliques with fewer seed. WT, the wild type. Bars = 1 mm. (B) Silique length for the wild type and gtg mutants. Col (left panel) and Ws (right panel). Data represent mean ± se determined for 10 siliques from the primary inflorescences of six plants. *Significantly different from the wild type; P ≤ 0.05, Student’s t test. (C) Seed number and undeveloped seed per silique. Col (left panel) and Ws (right panel). Data represent mean ± se determined for five siliques from six to eight plants. *Significantly different from the wild type; P ≤ 0.05, Student’s t test. (D) and (E) Seed size is greater in gtg double mutants than the wild type. Data represent mean ± se for 250 seed (50 seed from five independent plants). *Significantly different from the wild type; P ≤ 0.05, Student’s t test. (F) Seed yield per plant. Data represent mean ± se from four to six independent plants. *Significantly different from the wild type; P ≤ 0.05, Student’s t test. (G) Fertilization of gtg1-2 gtg2-2 stigmas with wild-type pollen restores silique length. Reciprocal crosses were made between wild-type and gtg1-2 gtg2-2 plants. For each cross, five maternal plants were used with five to eight stigmas from each. Each stigma was crossed using pollen from at least three different flowers, each from individual plants. Data represent mean ± se from at least 25 siliques for each cross. *Significantly different from wild type × wild type; # = significantly different from gtg1-2 gtg2-2 × gtg1-2 gtg2-2; P ≤ 0.05, Student’s t test.
Figure 10.
Figure 10.
GUS Reporter Constructs Reveal a Broad Expression Pattern for GTG1 and GTG2. (A) Expression of GTG1 genomic GTG1:GTG1-GUS reporter. (B) Expression of GTG2 genomic GTG2:GTG2-GUS reporter. CL, cauline leaf; FL, flower and insert photograph of anther showing GUS-stained pollen; IF, inflorescence; RL, rosette leaf; RT, root tip; SD, seedling.
Figure 11.
Figure 11.
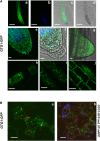
Localization of GTG1-GFP in Arabidopsis and Tobacco. (A) Stable expression of GTG1pro:GTG1-GFP in Arabidopsis. Images a to d show GTG1-GFP expression in root tip, 4′,6-diamidino-2-phenylindole (DAPI)–stained nuclei, combined image, and the transmission light image, respectively. Bars in a to d = 100 μm. GTG1-GFP expression was observed in e, primary root tip, nuclei stained with DAPI; f, primary root tip, nuclei stained with DAPI, combined with transmission light image; g, lateral root primordium. h and i, GTG1-GFP expression in unexpanded root cells showing Golgi localization; j, expanded root file cells showing more diffuse localization. Bars in e to j = 10 μm. (B) Transient expression of 35Spro:GTG1-GFP in tobacco leaf cells showing ER and Golgi localization. a, expression of GTG1-GFP in ER and Golgi (chloroplasts appear red); b, colocalization of GTG1-GFP (green) with the Golgi marker ST-mRFP (red) shown in yellow. ST-mRFP also marks the apoplastic space (thick red lines) and chloroplasts appear blue. Bars = 20 μm.
Figure 12.
Figure 12.
Microarray Analysis and Real-Time PCR Reveal Altered Gene Expression in the gtg1 gtg2 Double Mutants Compared with the Wild Type. (A) Functional groups with a significantly higher percentage of genes changing in the mutant. The number of genes in each functional group is expressed as a percentage. Black bars: percentage assigned for total genes expressed (mapped 9148 genes from 9009). Gray bars: percentage assigned for the genes showing a significant change (twofold or greater) in the mutant (P ≤ 0.1) and includes up- and downregulated genes (mapped 300 from 295 genes); the upregulated genes (striped bars) and downregulated genes (white bars) are indicated separately. Functional groups are those designated by MapMan software (http://mapman.gabipd.org/web/guest/home). (B) Comparison of expression changes analyzed by microarray and real-time PCR. Microarray expression (black bars) and real-time PCR expression (gray bars) comparing 11 genes in 6-d-old gtg1-2 gtg2-2 and wild-type Col seedlings grown on 0.5× MS. YLS8 was used for data normalization for real-time PCR. Data shown are fold changes for up- and downregulated genes (mean ± se of three or four independent biological replicates).

Similar articles

Cited by

References

    1. Abe M., Katsumata H., Komeda Y., Takahashi T. (2003). Regulation of shoot epidermal cell differentiation by a pair of homeodomain proteins in Arabidopsis. Development 130: 635–643 - PubMed
    1. Anantharaman V., Abhiman S., de Souza R.F., Aravind L. (2011). Comparative genomics uncovers novel structural and functional features of the heterotrimeric GTPase signaling system. Gene 475: 63–78 - PMC - PubMed
    1. Assmann S.M. (2002). Heterotrimeric and unconventional GTP binding proteins in plant cell signaling. Plant Cell 14 (suppl.): S355–S373 - PMC - PubMed
    1. Barrero J.M., Piqueras P., González-Guzmán M., Serrano R., Rodríguez P.L., Ponce M.R., Micol J.L. (2005). A mutational analysis of the ABA1 gene of Arabidopsis thaliana highlights the involvement of ABA in vegetative development. J. Exp. Bot. 56: 2071–2083 - PubMed
    1. Boavida L.C., McCormick S. (2007). Temperature as a determinant factor for increased and reproducible in vitro pollen germination in Arabidopsis thaliana. Plant J. 52: 570–582 - PubMed

Publication types

MeSH terms

Associated data