. 2012 Nov;15(11):1572-80.
doi: 10.1038/nn.3225. Epub 2012 Sep 23.

The spatial structure of a nonlinear receptive field

Affiliations

The spatial structure of a nonlinear receptive field

Gregory W Schwartz et al. Nat Neurosci. 2012 Nov.

Abstract

Understanding a sensory system implies the ability to predict responses to a variety of inputs from a common model. In the retina, this includes predicting how the integration of signals across visual space shapes the outputs of retinal ganglion cells. Existing models of this process generalize poorly to predict responses to new stimuli. This failure arises in part from properties of the ganglion cell response that are not well captured by standard receptive-field mapping techniques: nonlinear spatial integration and fine-scale heterogeneities in spatial sampling. Here we characterize a ganglion cell's spatial receptive field using a mechanistic model based on measurements of the physiological properties and connectivity of only the primary excitatory circuitry of the retina. The resulting simplified circuit model successfully predicts ganglion-cell responses to a variety of spatial patterns and thus provides a direct correspondence between circuit connectivity and retinal output.


Figures

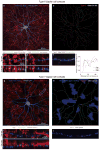
Figure 1
Figure 1. The receptive fields of On alpha-like RGCs have heterogeneous structure and nonlinear subunits
a, Image of a RGC superimposed on the spatial component of the linear receptive field derived from white noise stimulation. Ellipse is the 2σ Gaussian profile. b, One-dimensional profile of a slice of the receptive field denoted by the red line in a. c, Average temporal filter from the pixels inside the ellipse in a. c, Excitatory input currents elicited by temporally-modulated discs (top) and 44 μm bars (bottom; see Methods). d, Frequency doubled response power as a function of bar width.
Figure 2
Figure 2. Nonlinear and heterogeneous receptive field properties cause unique responses to stimuli with fine spatial structure
a, Top, Texture stimuli with different spatial scales (see Methods for stimulus construction). Bottom, firing rate of an example cell in response to the presentation of each texture stimulus shown above. Textures were flashed for 0.5 s with 1 s blank between trials with a maintained light level throughout. Gray bar indicates texture presentation. b, Mean spike count as a function of the spatial scale of the texture. Error bars are s.e.m. across cells (n = 7). Arrowhead indicates spatial scale used for the stimuli in panels c–e. c, Top, Examples of two texture stimuli generated with different random seeds. Middle and bottom, responses of two different On alpha-like RGCs to texture stimuli generated with eight random seeds. d, Stimulus examples and responses elicited by the same texture stimulus translated 33 μm in eight different directions. e, Stimulus examples and responses elicited by the same texture stimulus presented at eight different rotation angles. Error bars in c–e are s.d. across trials.
Figure 3
Figure 3. Excitatory inputs and spike response share similar sensitivity to rotation
a, Average firing rate and excitatory input current measured from the same cell in response to a texture stimulus presented at two different rotation angles. Gray bar indicates texture presentation. b, Spike count (top) and charge transfer in excitatory input currents (bottom) at each rotation angle for the cell in a. c, Normalized spike count vs. normalized change transfer of excitatory input current in response to rotations of a texture stimulus (n = 4 cells 32 total angles). Dashed line is unity. d, Maximum linear Fisher information about rotation angle across different texture scales for spike counts or charge transfer (see Methods). Dashed lines connect points from the same cell.
Figure 4
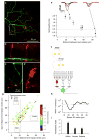
Figure 4. Type 6 bipolar cells contact the majority of excitatory post-synaptic sites on the On alpha-like RGC
a, On alpha-like RGC filled with tdTomato (blue) with labelled putative post-synaptic sites identified by puncta of postsynaptic density protein PSD95-CFP (green). Type 6 bipolar cell axon terminals are labelled with an antibody to Synaptotagmin-2 (Syt2, red). All On bipolar cells were labelled by Grm6-YFP (not shown in this panel). Boxed region is inset for c–e. b, Putative post-synaptic sites from a are colored according to whether they were apposed to a type 6 bipolar cell (red) or a different On bipolar cell (white). c. Top and side views of a stretch of the RGC dendrite. All On bipolar cells are labelled by Grm6-YFP (red). d. Same region as in c with only the type 6 bipolar cell label (Syt2) shown in red. e. Synapse identification for the region in c,d. f, Fraction of type 6 bipolar cell synaptic contacts as a function of distance from the soma for 3 cells. g. A different On alpha-like RGC labelled as in a, in a genetic background with type 7 bipolar cells labelled (Gus-GFP; red). Boxed region is inset for i,j. h. Identification of type 7 synaptic contacts. Blue shows regions lacking type 7 cone bipolar labeling. i. Magnified view of a stretch of RGC dendrite. j. Synapse identification for the region in i.
Figure 5
Figure 5. Nonlinear spatial interactions in the receptive field are aligned to the locations of type 6 bipolar cells
a, Maximum intensity projection fluorescence image of the RGC dendrites (green) and genetically labeled bipolar cells (red). b, Side view of the RGC and bipolar cells in a. c, Magnification of the boxed region in a showing the interaction between a type 6 bipolar cell and the RGC dendrites in a 1.5 μm plane of the image stack. d, Projection of the type 6 bipolar cell from the axon terminal to the dendrites where the stimuli were aligned (see Methods) in the same region as c. e, top, Average excitatory input currents to a RGC in response to small spots presented individually (solid black traces) or simultaneously (red trace). The dashed trace is the linear sum of the individual spot responses. bottom, Nonlinearity index (see Methods) as a function of the distance between the centers of the stimulus spots. Error bars are s.e.m. (n = 291 total spot pairs in 17 RGCs). f, Schematic of the logic of the experiment to determine if type 6 bipolar cells provided nonlinear input to RGCs. We tested the nonlinear interaction between spots that were located either within or across the presumed boundary of a type 6 bipolar cell receptive field. g, Nonlinearity index plotted in a color scale for each pair of spots (n = 170) with distance between spots either 18 μm or 28 μm. Locations of points along the ordinate and abscissa indicate the distance of each of the two spots from the labelled bipolar cell center (see Methods). Dotted lines indicate the value of the bipolar cell receptive field radius yielding the most significant difference between “within” and “across” regions. h, Significance of the statistical test (p value of one-tailed t-test) that the nonlinearity index for “within” bipolar spot pairs exceeds that for “across” bipolar spot pairs plotted as a function of the assumed radius of the bipolar cell receptive field. i, Mean nonlinearity index in each region of g for a bipolar cell receptive field radius of 22 μm.
Figure 6
Figure 6. Construction of the bipolar cell weight map from anatomical measurements
a, Image of RGC dendrites (blue), PSD95-YFP (green), and type 6 bipolar cell (red). Putative synapses between the bipolar cell and RGC were counted as in Fig. 3. b, RGC dendrites were traced and the length of dendrite in the convex polygonal axonal territory of the bipolar cell axon terminal was measured (thin white lines). c, Number of putative synapses as a function of RGC dendritic length in the bipolar cell axon territory (n = 28 bipolar cell - RGC pairs; Raw data from ref. . Dashed line indicates best fit line through the origin (slope = 0.39 synapses/μm). d, Histogram of the bipolar cell axon area (mean = 227 ± 51 μm2). e, Model of bipolar cell weights based on the anatomical measurements in c and d. Tracing of RGC dendrites (green) and model of bipolar cell synaptic weights. Model bipolar cells with nonzero weights are outlined in black, and darker fill colors correspond to larger weights (see Methods).
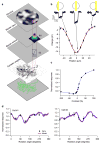
Figure 7
Figure 7. A predictive model of RGC responses to two-dimensional patterns of light
a, Schematic of the model (see Methods for details): 1) The stimulus is sampled by the receptive field of each bipolar cell subunit (see also panel b). 2) The resulting input is passed through the nonlinear output function of the bipolar cell (see also panel c). 3) The bipolar cell outputs are each weighted by the anatomical model and summed at the RGC. b, Measurement of the type 6 bipolar cell receptive field in one dimension. Charge transfer in response to 0.5 s steps of a bright bar (top) at different positions were fit by a one-dimensional Gaussian (bottom). c, Contrast-response function measurement. Uniform 300 μm discs of light were presented to the RGC while measuring excitatory input currents. The charge transfer, normalized to its maximum, is plotted as a function of the contrast of the stimulus. d, Response profiles of two RGCs to a texture stimulus at different rotation angles along with model predictions based on the measured nonlinear transfer function and imaged dendrites of each cell. Texture scale was 36 μm. Data points (black) are charge transfer, normalized to the mean, of RGC excitatory input currents (error bars are s.d.). The model prediction was calculated for each degree of rotation. Solid purple line is the mean and shaded region is the s.d. over 10 choices of random seed in the jittering of the bipolar cell grid (see Methods).
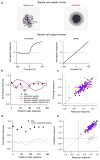
Figure 8
Figure 8. Tests of the predictive power of simplified receptive field models
a, Top, Bipolar cell weight maps based on the anatomical model (as in Fig. 6) or a circular two-dimensional Gaussian. Weight maps are normalized so that the darkest colors represent maximal weight, but the sum of the weights was constant across models. Bottom, Examples of a measured output nonlinearity, and a linear function replacing the output nonlinearity. b, Data from a single cell and predictions from models using the two different bipolar cell weight maps in a. The dashed line shows the prediction for an optimized Gaussian model with a free parameter to shift the stimulus relative to the Gaussian weight profile. The orange line shows the prediction for a Gaussian model where the stimulus is perfectly centered (a flat line by construction since the Gaussian weight map was radially symmetric). Error bars on the data are s.d. c, Measured responses vs. predictions from the anatomical (purple), Gaussian (red), and centered Gaussian (orange) bipolar weights models for a population of cells. d, Data points from b along with predictions for a model with linear bipolar cell output and anatomically estimated bipolar cell weights (purple). e, Measured responses vs. predictions from the nonlinear (filled symbols) and linear (open symbols) bipolar cell output models for the same population as in c. Both models used the anatomically defined bipolar cell weights. For population data in c and e, n = 10 cells at 80 total rotation angles.

Similar articles

Cited by

References

    1. Chichilnisky EJ. A simple white noise analysis of neuronal light responses. Network. 2001;12:199–213. - PubMed
    1. Pillow JW, et al. Spatio-temporal correlations and visual signalling in a complete neuronal population. Nature. 2008;454:995–999. - PMC - PubMed
    1. Pillow JW, Paninski L, Uzzell VJ, Simoncelli EP, Chichilnisky EJ. Prediction and decoding of retinal ganglion cell responses with a probabilistic spiking model. J Neurosci. 2005;25:11003–11013. - PMC - PubMed
    1. Enroth-Cugell C, Robson JG. The contrast sensitivity of retinal ganglion cells of the cat. J Physiol. 1966;187:517–552. - PMC - PubMed
    1. Caldwell JH, Daw NW. New properties of rabbit retinal ganglion cells. J Physiol. 1978;276:257–276. - PMC - PubMed

Publication types

MeSH terms