. 2012 Nov;44(11):1191-8.
doi: 10.1038/ng.2416. Epub 2012 Sep 23.

Breast cancer risk-associated SNPs modulate the affinity of chromatin for FOXA1 and alter gene expression

Affiliations

Breast cancer risk-associated SNPs modulate the affinity of chromatin for FOXA1 and alter gene expression

Richard Cowper-Sal lari et al. Nat Genet. 2012 Nov.

Abstract

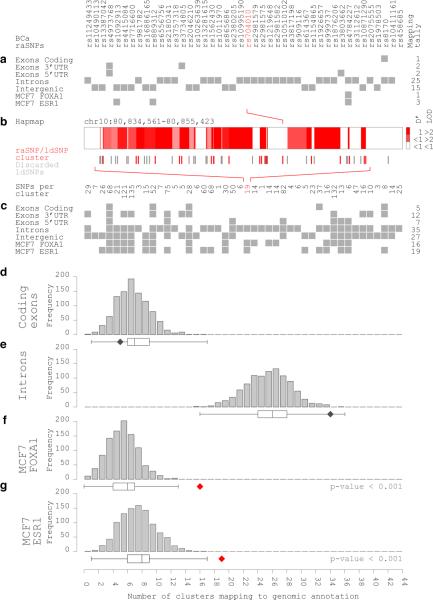
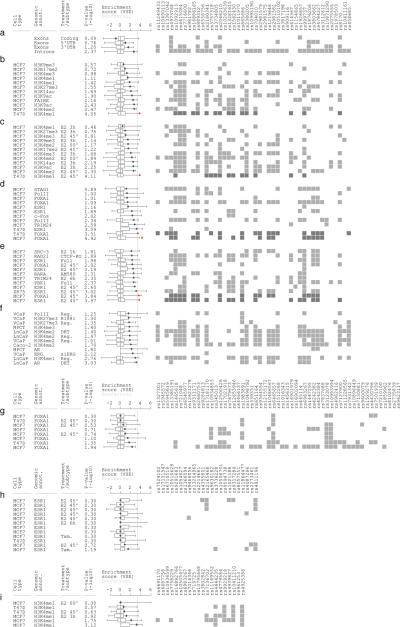
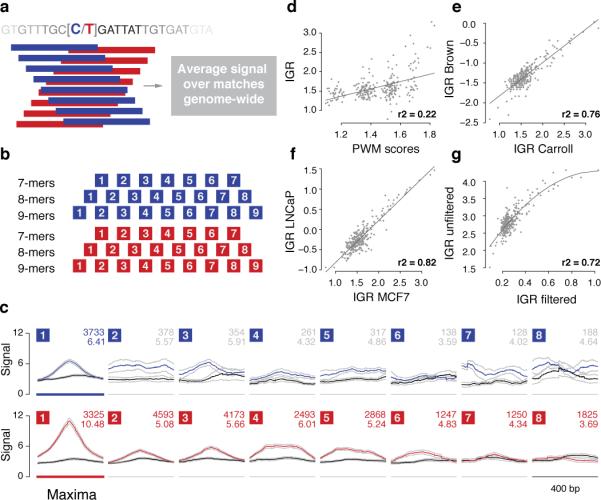
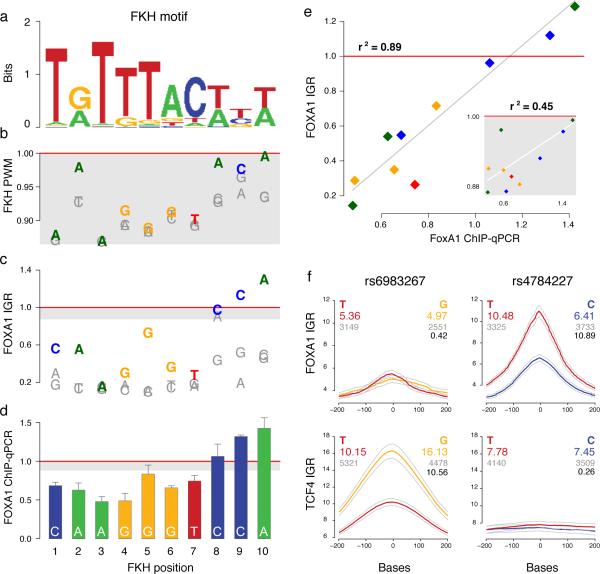
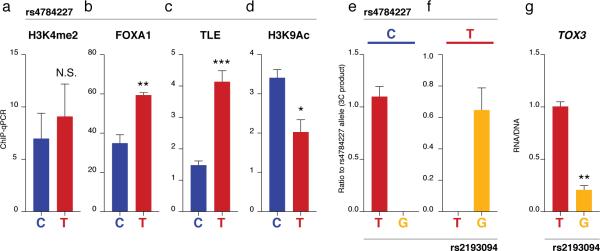
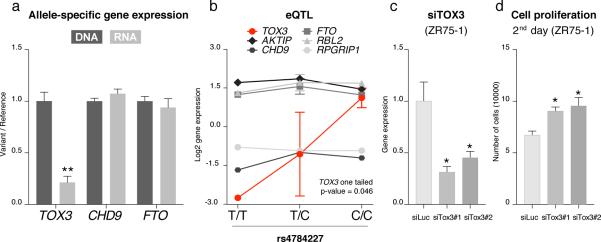
Genome-wide association studies (GWAS) have identified thousands of SNPs that are associated with human traits and diseases. But, because the vast majority of these SNPs are located in non-coding regions of the genome, the mechanisms by which they promote disease risk have remained elusive. Employing a new methodology that combines cistromics, epigenomics and genotype imputation, we annotate the non-coding regions of the genome in breast cancer cells and systematically identify the functional nature of SNPs associated with breast cancer risk. Our results show that breast cancer risk-associated SNPs are enriched in the cistromes of FOXA1 and ESR1 and the epigenome of histone H3 lysine 4 monomethylation (H3K4me1) in a cancer- and cell type-specific manner. Furthermore, the majority of the risk-associated SNPs modulate the affinity of chromatin for FOXA1 at distal regulatory elements, thereby resulting in allele-specific gene expression, which is exemplified by the effect of the rs4784227 SNP on the TOX3 gene within the 16q12.1 risk locus.


Figures

Figure 1
Figure 1
The BCa AVS is enriched in the cistromes of FOXA1 and ESR1. (a) Breast cancer (BCa) raSNPs. Binary matrix encodes raSNPs mapping to the genomic annotations. The mapping tally shows the number of raSNPs per annotation. (b) Haplotype block for SNP rs704010. SNPs included in raSNP/ldSNP clusters are highlighted in red. The bottom row of numbers indicates the number of ldSNPs per raSNP/ldSNP cluster. (c) BCa raSNP/ldSNP clusters. Binary matrix encodes clusters with at least one SNP mapping to the genomic annotations. The mapping tally shows the number of clusters per annotation. (d–g) Histograms and box plots showing the null distributions of the mapping tallies for each annotation. Nulls are based on 1000 Matched Random Variant Sets (MRVSs). Diamonds show mapping tallies for the BCa clusters. Red diamonds highlight mapping tallies for genomic annotations that fall outside of the null (P<0.001)
Figure 2
Figure 2
The enrichment of the BCa AVS is factor, cell-type and cancer-type specific. (a–f) Variant Set Enrichment (VSE) plots for the breast cancer AVS. Box plots in each panel show the normalized null distributions. Diamonds show the corresponding VSE scores. Colored diamonds highlight mapping tallies for genomic annotations that satisfy a Bonferroni corrected threshold for significance (P<10−3.3). P-values are based on null distributions based on 1000 MRVSs. Binary matrices encode raSNP/ldSNP clusters with at least one SNP mapping to the genomic annotations. Rows highlighted in dark gray show statistically significant enrichment for genomic annotations. (a) Core gene annotations. (b) Untreated epigenomes in BCa cells. (c) Treated epigenomes in BCa cells. (d) Untreated cistromes in BCa cells. (e) Treated cistromes in BCa cells. (f) Cistromes and epigenomes for control cell lines. (g) VSE plot for the prostate cancer AVS against FOXA1 cistromes. (h) VSE plot for the bone mineral density AVS against ESR1 cistromes. (i) VSE plot for the colorectal cancer AVS against H3K4me1 epigenomes.
Figure 3
Figure 3
The Intra-Genomic Replicates method. (a) Affinity models are calculated over a sliding window of K-mers around the SNP of interest for both reference (C, blue) and variant alleles (T, red). (b) Lattice structures of connected K-mer affinity models. (c) Lattice rows corresponding to 8-mers. Each cell, numbered 1 to 8, corresponds to an affinity model. The top numbers on the right of each cell indicate the number of genomic matches for each 8-mer. The bottom numbers indicate the average binding signal across all 8-mer matches. Greyed numbers indicate discarded cells within the lattice due to an insufficient number of matches. Colored lines show the averaged binding profiles over a 400 bp window centered on each 8-mer match. Black lines show the averaged binding profile for the scrambled 8-mer sequence. (d) Intra-Genomic Replicates (IGR) affinity scores for FOXA1 in MCF7 cells for a set of 256 8-mers against the Position Weighted Matrix (PWM) scores based on the forkhead (FKH) motif for the same set of 256 8-mers. (e) Comparison between IGR scores for FOXA1 in MCF7 cells obtained in two separate laboratories. (f) Comparison between IGR scores for FOXA1 obtained in MCF7 BCa cells and LNCaP PCa cells. (g) Comparison between IGR scores for FOXA1 in MCF7 cells obtained with or without the H3K4me2 accessibility filter.
Figure 4
Figure 4
The BCa raSNP rs4784227 modulates FOXA1 affinity by altering the forkhead (FKH) motif. (a) Sequence logo of the FKH motif. (b,c) FKH motif Position Weighted Matrix (PWM) and FOXA1 Intra Genomic Replicates (IGR) scores for each single base variation to the FKH motif. Values are normalized to their respective scores for the canonical FKH motif (red line). Gray areas shows the range of PWM scores. (d) FOXA1 ChIP-qPCR in MCF7 for each of the highest scoring variants across FKH positions. Each measurement is based on three replicates. FKH variants for each position assayed through ChIP-qPCR are highlighted in color and bold typeface in b and c. (e) Scatter plots and regressions for the comparison between the FOXA1 IGR scores and FOXA1 ChIP-Seq profiles in MCF7. The inset shows the comparison between FKH PWM scores and ChIP-Seq profiles. (f) IGR profiles for SNPs rs6983267 and rs4784227. Colored numbers: average binding across instances. Black: -log10 of the p-values obtained by IGR. Gray: numbers of K-mer instances in the genome.
Figure 5
Figure 5
The BCa AVS is enriched in affinity modulating SNPs. (a) The percentage of FOXA1 affinity modulating raSNP/ldSNP clusters over all clusters with SNPs mapping to FOXA1 or H3K4me2 sites in BCa raSNPs. The histogram shows the null distribution of this percentage over 1000 MRVSs. (b) Allele-specific ChIP-qPCR result for the 13 heterozygous SNPs found in BCa cell lines. y axis represents log2-transformed fold change of FOXA1 binding level between variant and reference alleles for each SNP. Red indicates the SNPs that demonstrate a significant and concordant allele-specific binding preference for FOXA1 predicted by IGR.
Figure 6
Figure 6
The BCa raSNP rs4784227 disrupts enhancer function through FOXA1 affinity modulation. (a–d) ChIP-qPCR for H3K4me2 histone modification (enhancer), FOXA1 and TLE binding and H3K9Ac (active enhancer) at rs4784227. The C allele is the reference and the T allele is the risk variant. (e,f) 3C sequencing results showing the physical interactions between heterozygous SNPs at the enhancer (rs4784227) and TOX3 intron (rs2193094). (g) Ratio between RNA and DNA levels for both alleles in the TOX3 intron. Error bars, SEM from three replicate measures.
Figure 7
Figure 7
The BCa raSNP rs4784227 affects cell proliferation by disrupting TOX3 gene expression. (a) Ratio between variant and reference alleles for DNA and RNA levels of each SNP (rs2193094 in TOX3; rs35925303 in CHD9; rs11646260 in FTO). (b) Cell line-based e-QTL results for the SNP rs4784227 and expression level of the gene TOX3 (rs4784227: T47D, T/T; HCC1428, C/T; MCF7, C/T; MDA-MB-415, C/T; UACC-812, C/C; ZR-75-1, C/C; BT-474, C/C; BT-483, C/C; MDA-MB-175VII, C/C; 600MPE, C/C; ZR-75-30, C/C). (c) TOX3 silencing in ZR75-1 cells. (d) The number of cells counted 2 days after TOX3 silencing. N.S., not significant; *, p≤0.05; **, p≤0.01; ***, p≤0.001. Error bars, SEM from three replicate measures.
Figure 8
Figure 8
Diagram of the TOX3 locus and the physical interactions between and within chromosome 16 homologs.

Comment in

  • FOXA1 and breast cancer risk.
    Meyer KB, Carroll JS. Meyer KB, et al. Nat Genet. 2012 Nov;44(11):1176-7. doi: 10.1038/ng.2449. Nat Genet. 2012. PMID: 23104063

References

    1. Frazer K, Murray S, Schork N, Topol E. Human genetic variation and its contribution to complex traits. Nature Reviews Genetics. 2009;10:241–251. - PubMed
    1. Durbin R, et al. A map of human genome variation from population-scale sequencing. Nature. 2010;467:1061–1073. - PMC - PubMed
    1. Heintzman N, et al. Distinct and predictive chromatin signatures of transcriptional promoters and enhancers in the human genome. Nature genetics. 2007;39:311–318. - PubMed
    1. Lupien M, et al. Foxa1 translates epigenetic signatures into enhancer-driven lineage-specific transcription. Cell. 2008;132:958–970. - PMC - PubMed
    1. Heintzman N, et al. Histone modifications at human enhancers reflect global cell type-specific gene expression. Nature. 2009;459:108. - PMC - PubMed

Publication types

Associated data