. 2012 Oct;18(10):1586-91.
doi: 10.1038/nm.2935. Epub 2012 Sep 23.

Annotating MYC status with 89Zr-transferrin imaging

Affiliations

Annotating MYC status with 89Zr-transferrin imaging

Jason P Holland et al. Nat Med. 2012 Oct.

Abstract

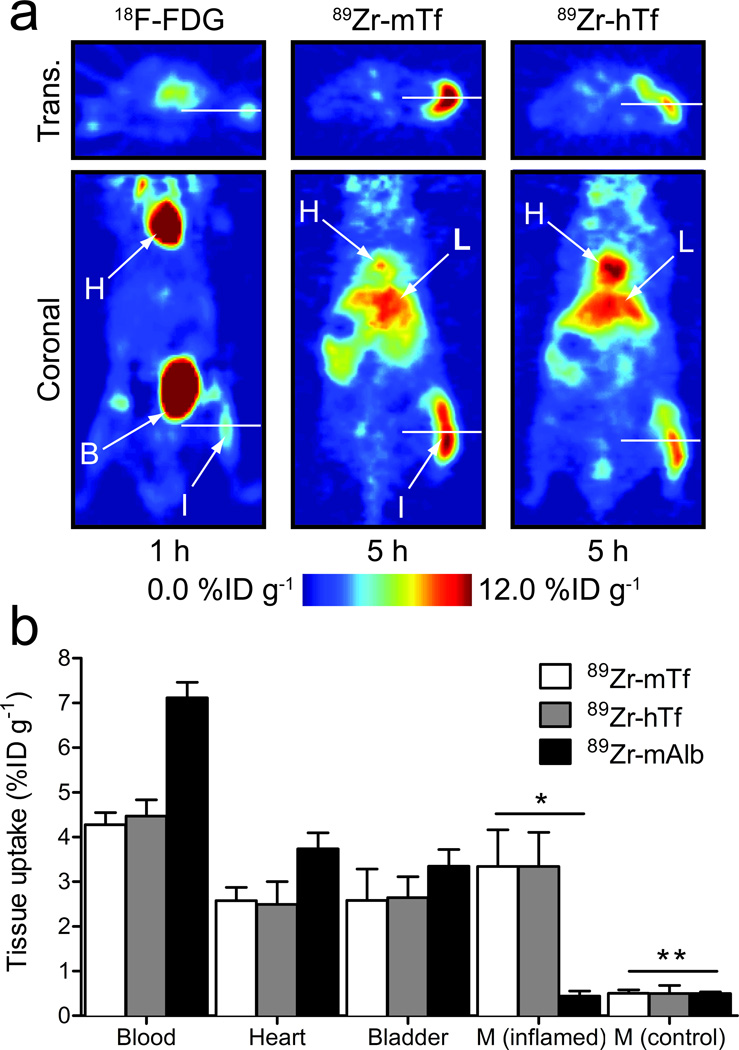
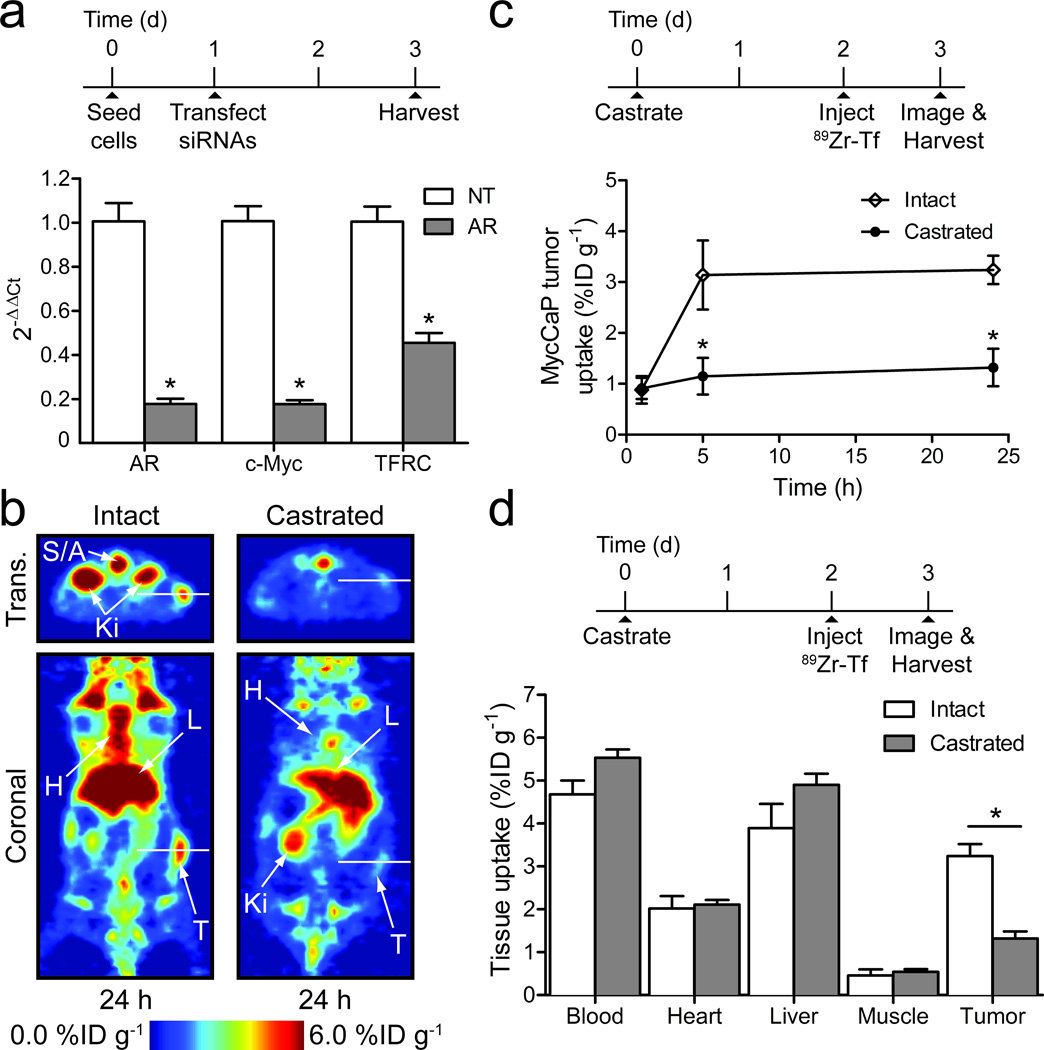
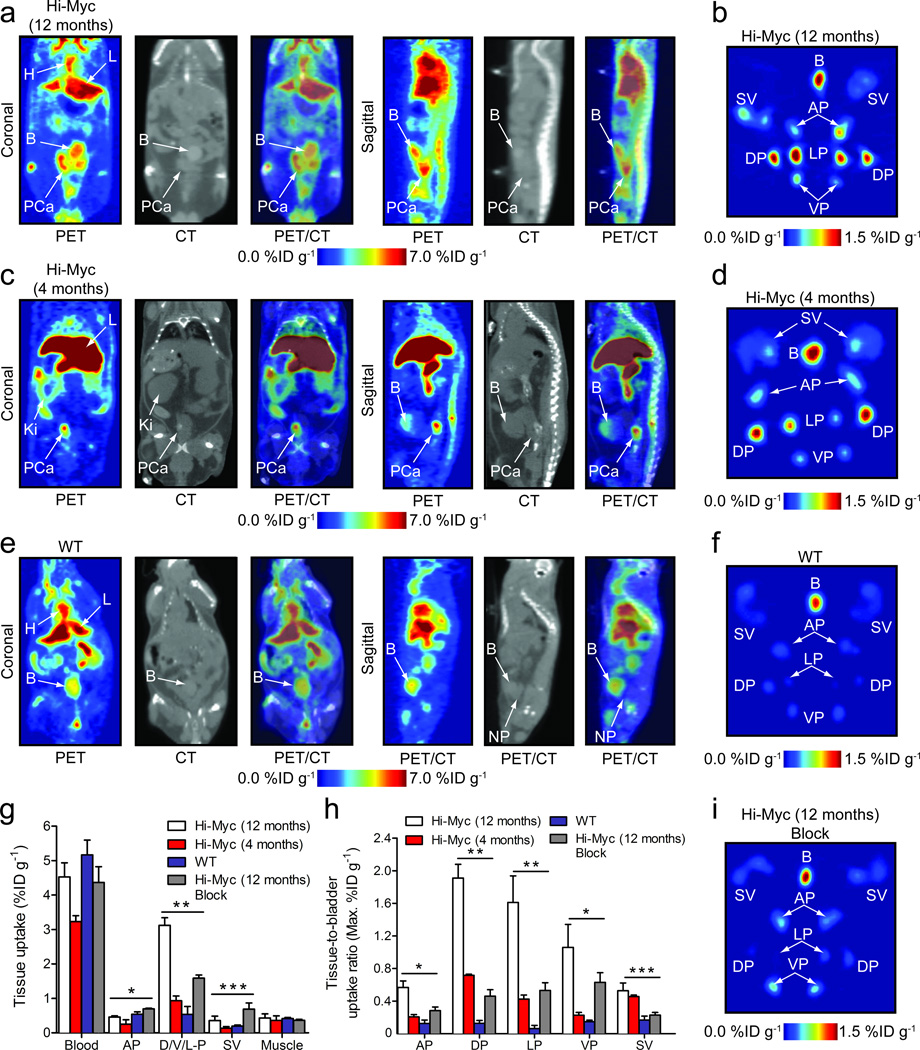
A noninvasive technology that quantitatively measures the activity of oncogenic signaling pathways could have a broad impact on cancer diagnosis and treatment with targeted therapies. Here we describe the development of (89)Zr-desferrioxamine-labeled transferrin ((89)Zr-transferrin), a new positron emission tomography (PET) radiotracer that binds the transferrin receptor 1 (TFRC, CD71) with high avidity. The use of (89)Zr-transferrin produces high-contrast PET images that quantitatively reflect treatment-induced changes in MYC-regulated TFRC expression in a MYC-driven prostate cancer xenograft model. Moreover, (89)Zr-transferrin imaging can detect the in situ development of prostate cancer in a transgenic MYC prostate cancer model, as well as in prostatic intraepithelial neoplasia (PIN) before histological or anatomic evidence of invasive cancer. These preclinical data establish (89)Zr-transferrin as a sensitive tool for noninvasive measurement of oncogene-driven TFRC expression in prostate and potentially other cancers, with prospective near-term clinical application.


Figures

Figure 1
Figure 1. PET imaging of inflammation with 89Zr-Tf
(a) Comparison of representative transverse and coronal PET images of 18F-FDG and 89Zr-Tf in a subcutaneous, turpentine-oil induced model of inflammation in WT immunocompetent male mice. H=heart; L=liver; B=bladder; I=inflamed tissue. (b) Selected biodistribution data showing the uptake and accumulation of 89Zr-mTf (n=5), 89Zr-hTf (n=5) and the control compound 89Zr-mAlb (n=2) in the blood pool, heart, bladder, inflamed and non-treated (contralateral control) muscle at 24 h post-i.v. radiotracer administration (see Supplementary Table 2, Supplementary Fig. 7 and 8). M = Muscle; * P<0.01 for 89Zr-mTf and 89Zr-hTf vs. 89Zr-mAlb, P<0.01 for 89Zr-mTf and 89Zr-hTf inflamed versus control muscle uptake; ** P>0.05 for all comparisons between control muscle radiotracer uptake.
Figure 2
Figure 2. In vitro and in vivo studies on 89Zr-mTf in MycCaP prostate cancer models
(a) In vitro qPCR data showing the relative change in androgen receptor (AR), c-Myc and TFRC gene expression 48 h after transfection with non-targeted (NT) and AR-targeted siRNAs (n=4). * P<0.01 for all AR knockdown versus NT comparisons. (b) Representative PET imaging of 89Zr-mTf uptake in male mice bearing MycCaP xenografts at 24 h post-radiotracer administration in both intact and castrated models. The radiotracer was administered 48 h after animals were castrated or unmanipulated (see Supplementary Fig. 11 for 18F-FDG imaging of MycCaP xenografts). S/A=spine/aorta; Ki=kidneys; H=heart; L=liver; T=tumor. (c) Time-activity curves for MycCaP uptake of 89Zr-mTf. * P<0.001 intact versus castrate data at 5 and 24 h time points. (d) Selected biodistribution data showing the uptake and accumulation of 89Zr-mTf in intact (n=4) and castrated (n=5) mice bearing MycCaP xenografts at 24 h post-radiotracer administration (see Supplementary Tables 3 and 4, and Supplementary Fig. 12). * P<0.001 intact versus castrate tumor uptake.
Figure 3
Figure 3. Co-registered PET/CT imaging and ex vivo prostate tissue studies of 89Zr-mTf in Hi-Myc (12 and 4 month old) and WT mice
All in vivo images were recorded 16 h post-i.v. administration of 89Zr-mTf (11.6–13.7 MBq, [313–370 μCi], 35–41 µg of protein/mouse). H=heart; L=liver; Ki=kidney; B=bladder; PCa=prostate cancer; NP=normal prostate. Ex vivo PET images were recorded at 24 h post-administration. (a) Representative coronal and sagittal planar PET/CT images recorded in Hi-Myc (12 mo) mice displaying an advanced phenotype of adenocarcinoma of the prostate. (b) Ex vivo PET image of the excised prostate from the mouse shown in 3a. B=bladder; SV=seminal vesicle; AP=anterior prostate; DP=dorsal prostate; LP=lateral prostate; VP=ventral prostate. (c) Representative PET/CT images recorded in Hi-Myc (4 mo) mice displaying a phenotype indicative of localized adenocarcinoma after PIN transition before morphological changes have occurred. In this model the prostate is the same size as compared to WT mice. (d) Ex vivo PET image of the excised prostate from the mouse shown in 3c. (e) Representative PET/CT images recorded in WT mice showing the absence of radiotracer uptake in normal prostatic tissue. (f) Ex vivo PET image of the excised prostate from the mouse shown in 3e. (g) Selected biodistribution data showing the uptake of 89Zr-mTf in prostate tissues for Hi-Myc (12 mo; n=4 normal and blocked animals), Hi-Myc (4 mo; n=4) and WT mice (n=3) at 24 h post-radiotracer administration (see Supplementary Tables 6 and 7, and Supplementary Fig. 18 for complete data sets). * P>0.05 for all comparisons indicating no difference in AP uptake; ** P<0.01 for Hi-Myc (12 mo and 4 mo) versus WT DP uptake and for comparison between 89Zr-mTf uptake in normal and block Hi-Myc (12 mo) groups; *** P>0.05 for all comparisons indicating no difference in SV uptake. (h) Tissue-to-bladder maximum uptake ratios derived from PET images of the ex vivo prostate studies. * P<0.01 for Hi-Myc (12 mo) versus WT and blocked animals, and P<0.05 Hi-Myc (4 mo) versus WT uptake; ** P<0.01 for all comparisons with Hi-Myc (12 mo) animals; *** P>0.05 for Hi-Myc (12 mo) versus Hi-Myc (4 mo) SV uptake, and P<0.05 Hi-Myc (12 and 4 mo) versus WT and blocked Hi-Myc (12 mo) SV uptake. (i) Ex vivo PET image of the excised prostate from a mouse that received a blocking dose of holo-Tf.

References

    1. Gatter KC, Brown G, Trowbridge IS, Woolston RE, Mason DY. Transferrin receptors in human tissues: their distribution and possible clinical relevance. J Clin Pathol. 1983;36:539–545. - PMC - PubMed
    1. Neckers LM, Trepel JB. Transferrin receptor expression and the control of cell growth. Cancer Invest. 1986;4:461–470. - PubMed
    1. Richardson DR. Therapeutic potential of iron chelators in cancer therapy. Adv Exp Med Biol. 2002;509:231–249. - PubMed
    1. Taetle R, Honeysett JM, Trowbridge I. Effects of anti-transferrin receptor antibodies on growth of normal and malignant myeloid cells. Int J Cancer. 1983;32:343–349. - PubMed
    1. Weiner RE. The mechanism of 67Ga localization in malignant disease. Nucl Med Biol. 1996;23:745–751. - PubMed

Publication types